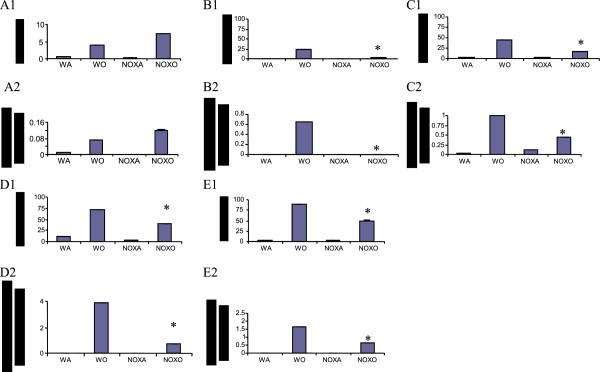
Figure 8.

Decreased iNOS + cells in KO mice. Cells from all tissues viz. BM, PB, Spleen, lung and BALf of NOX−/− vs. WT with and without OVA. or we could put % and # in tabular form. A1-E1. Percent iNOS positive cells in BM, PB, Spleen, LP and BALf respectively. A2-E2. Number of iNOS positive cells in BM, PB, Spleen, LP and BALf respectively cells in million. Data shows mean of 2 independent experiments which were pooled ± SEM. (* denotes p value<0.05 compared to WO). Abbreviations used are: WT=wildtype, NOX=gp91phox−/−, WA=WT+alum, WO=WT+OVA, NOXA=gp91phox−/−+alum, NOXO=gp91phox−/−+OVA.
