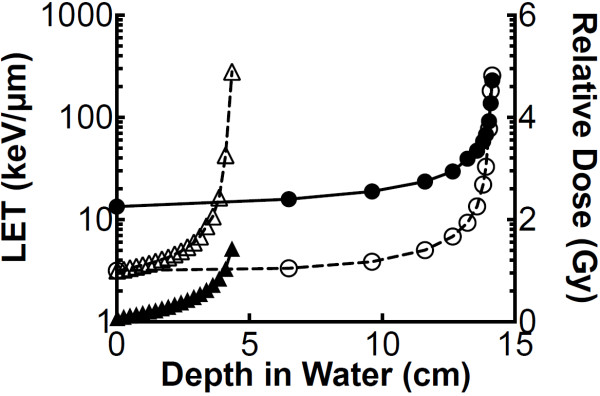
Figure 1.

Dose and LET at each depth in water. Open circles represent relative dose of proton (70 MeV) compared to entrance, and closed circles represent LET spectrum of proton. Open triangles represent relative dose of carbon ions (290 MeV/n) compared to entrance, and triangles represent LET spectrum of carbon ions.
