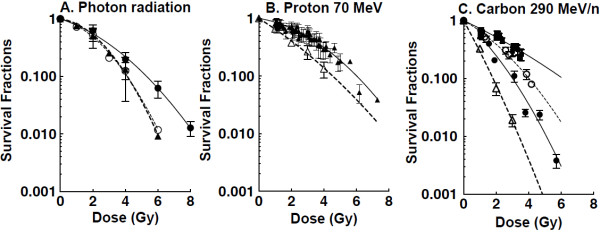
Figure 3.

Dose response curves for proton and carbon ions. Survival fraction per dose obtained by OptiCell™ was calculated from Figure 1 and 2. Cell survival curves in standard cell culture dishes are also plotted. A. photon radiation, gamma-ray survival obtained by OptiCell™ was described by closed circles. Standard survival assay for x-ray was described by closed triangles and gamma-rays was described by open circles. B. proton, closed triangles represent OptiCell™ survival and open triangles represent standard survival. C. carbon ions, closed squares represent LET 13–20 keV/μm, open circles represent LET 20–30 keV/μm, closed circles represent LET >30 keV/μm obtained by the OptiCell™ system. Open triangles represent monoenergetic carbon ions LET 70 keV/μm. Error bars indicate standard errors of the means from as many as four independent experiments.
