
Figure 3.
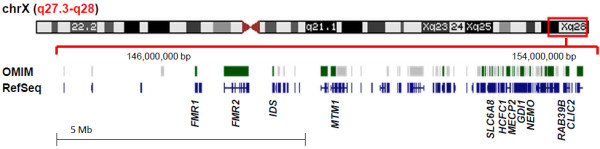
Schematic of X chromosome and genes in the Xq27.3-q28 region. Region of deletion is highlighted by the red box. Shown are the OMIM-disease associated genes in green and all RefSeq genes in blue within the deletion region of 144,270,614-154,845,961 bp (hg19). Image was adapted from http://genome.ucsc.edu/cgi-bin/hgTracks.