Figure 3.

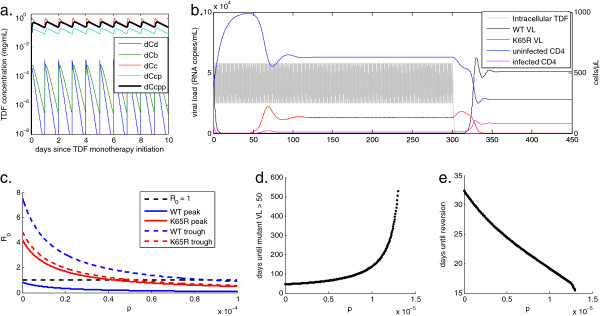
Effect of immune pressure on rate of development and reversion of drug resistance. (a) Concentration of digestive (Cd), plasma (Cb), intracellular (Cc), intracellular phosphorylated (Ccp), and intracellular diphosphorylated (Ccpp) tenofovir using the model of Dixit and Perelson [42] that includes drug partitioning across the cell membrane. (b) Example of viral load and CD4+ T cell response to TDF monotherapy with perfect adherence and cessation after 300 days. TDF-DP concentration, re-scaled from (a) in units of μg/mL along the righthand axis, is overlaid for reference. (c) Basic reproductive ratio of WT and drug-resistant virus at steady-state peak and trough TDF-DP concentrations, as a function CTL efficacy p varied with f to maintain a setpoint viral load of 51,000 copies/mL. (d) Influence of p, varied as in (c), on the time from HIV infection on TDF monotherapy until emergence of the K65R mutant at a viral load above 50 copies/mL. The time to resistance is 29 days at p = 0, and rises to ever-increasing durations as p reduces R0. (d) Influence of p on the time until reversion of resistance after monotherapy cessation. Reversion times range from 37 days at p = 0 to 15 days as R0 approaches 1.
