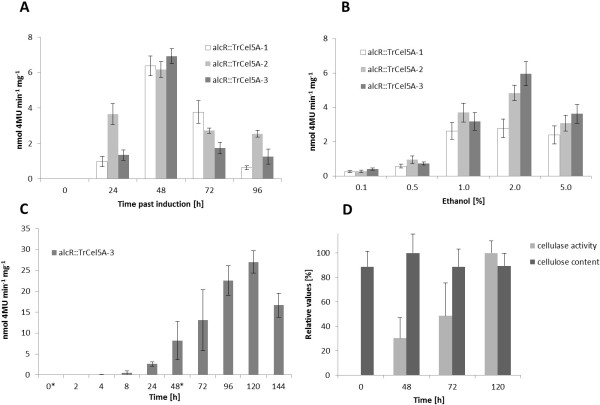
Figure 4.
Effects of Ethanol induction on transgenic plants. Activity on 4MUC measured over time after ethanol induction in six-week-old soil-grown plants (A). Plants were induced at t0 by applying 2% ethanol in 100 ml irrigation water, and cellulase activity was monitored over a 96 h time course. Ethanol dose response in alcR::TrCel5A lines (B). Transgenic lines were monitored for cellulase activity 24 h after watering. Values represent the mean of three plants per independent transgenic line. Effect of sequential ethanol induction (C). Six-week-old soil-grown plants from the homozygous line F6.5 were induced using 2% ethanol at t0 and again after 48 h (asterisks). Cellulase activity was monitored over 144 h. Wild-type plants were monitored in parallel, and no cellulase activity was observed throughout the time course. Comparison of cellulose content and cellulase activity after repeated induction with ethanol (D). A relative value of 100% cellulase activity represents a conversion of 27 nmol 4MU min-1 mg-1, whereas a value of 100% for cellulose content represents 140 μg glucose per mg alcohol insoluble residue (AIR). For all panels, values represent the mean of three plants per independent transgenic line. Error bars the show standard deviation of the mean after subtraction of wild-type control data.

