Figure 2.

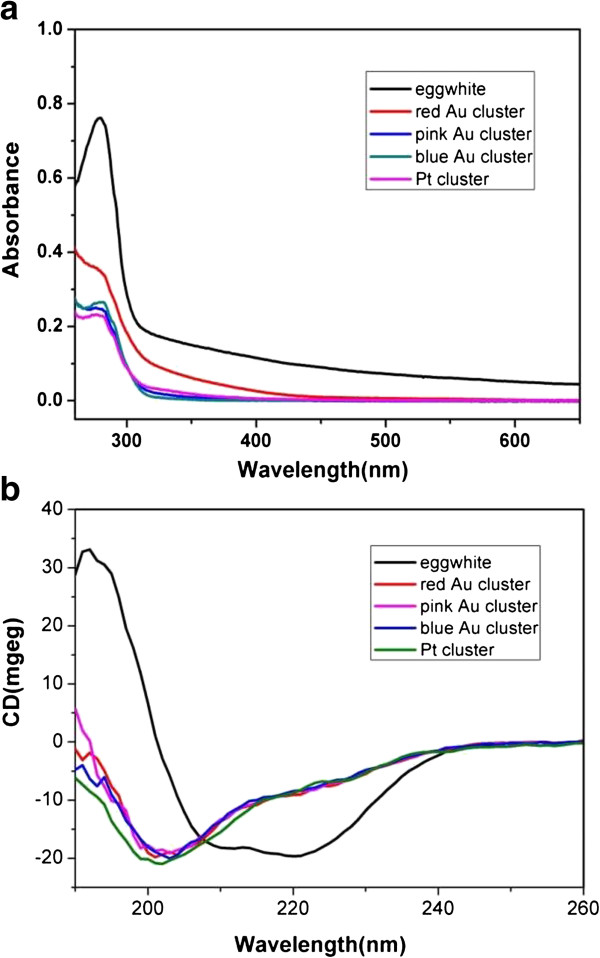
Spectral Analysis of aqueous solution of chicken egg white and metal clusters. (a) UV-vis absorption spectra; (b) CD spectra.

Spectral Analysis of aqueous solution of chicken egg white and metal clusters. (a) UV-vis absorption spectra; (b) CD spectra.