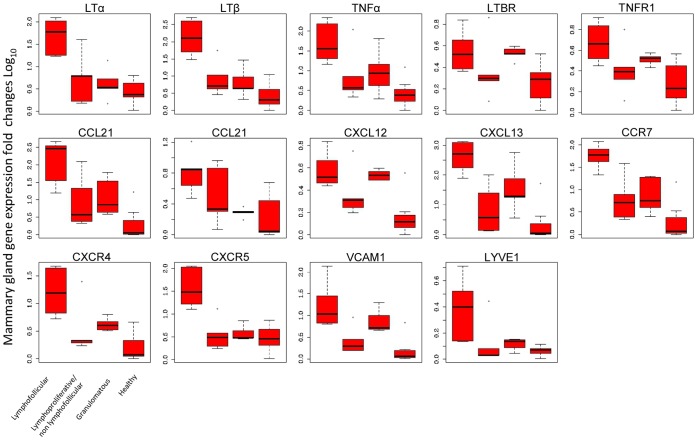
Figure 6. Differential qRT-PCR gene expression for cytokines, chemokines, receptors, and adhesion molecules involved in inflammatory responses.
Total mRNA was isolated from inflamed sheep mammary glands showing lymphofollicular, lymphoproliferative/non-lymphofollicular, and granulomatous mastitis, as well as from histologically and microbiologically healthy ovine mammary glands (Groups A, B, C, and D, respectively, as described in “Materials and Methods”). Differences in specific gene expression levels were calculated as fold changes in transcripts between the mammary gland tissue samples under study versus one histologically and microbiologically healthy sheep mammary gland, which was used as the reference value. Each boxplot represents log-transformed gene expression levels in the different groups of cytokines, chemokines, and their receptors, together with adhesion molecules. The box represents the 25th to 75th quartile, the whiskers represent the range, and the horizontal line in the box is the median. White dots beyond the whiskers indicate outliers. The sample values were normalized to housekeeping sheep 18S gene level. The X-axis legend is common for all 14 graphics. P values among the different groups are shown in Table 3.

