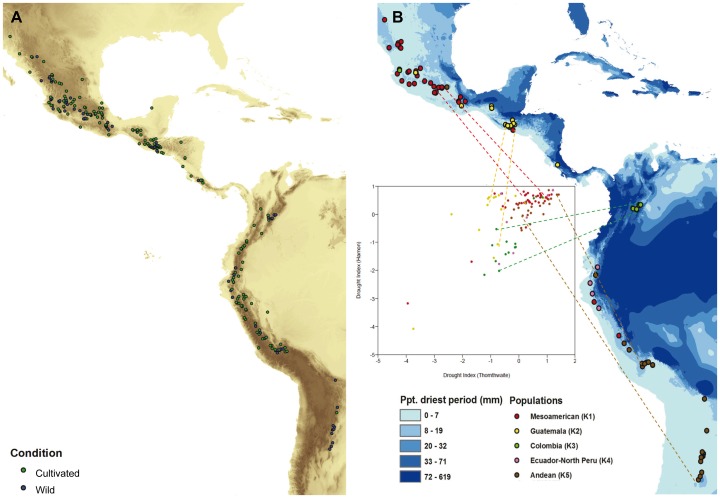
Figure 1. Geographic distribution of wild (104 accessions) and cultivated (297 accessions) common bean accessions (A), and precipitation during the driest period along the geographic range of wild common bean (B).
A dispersion diagram between the estimated drought index using the potential evapo-transpiration (PET) of Thornthwaite and the estimated drought index using the PET of Hamon is presented in B. Populations definition as in Blair et al. [26] and Broughton et al. [27].

