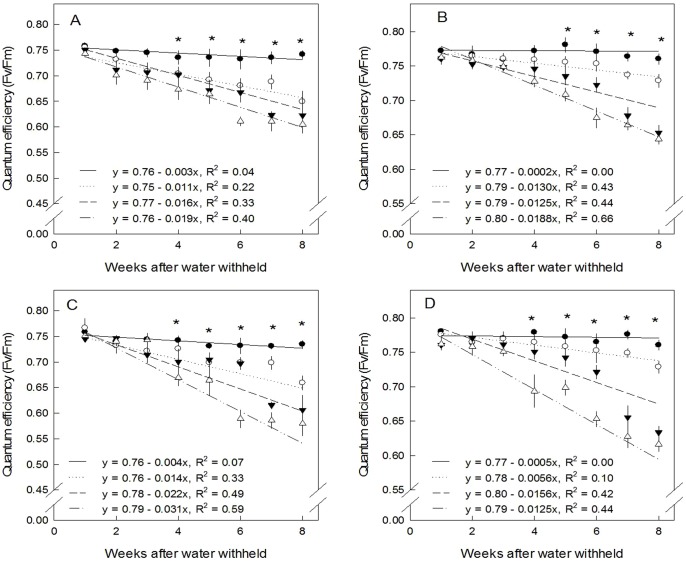
Figure 3. Effect of water limitation on quantum effciency during 8 weeks drought stress treatment.
n = 5 (A) Morocco leaves, (B) Morocco stem, (C) Senegal leaves (D) Senegal stem, (•) VWC 25%, (○) VWC 15%, (▾) VWC 10% and (Δ) VWC 5%, n = 5. Vertical error bars denote the standard error of mean (SEM). Stars above the point denote significant difference between VWC in each week treatment following the Tukey procedure (p<0.05).

