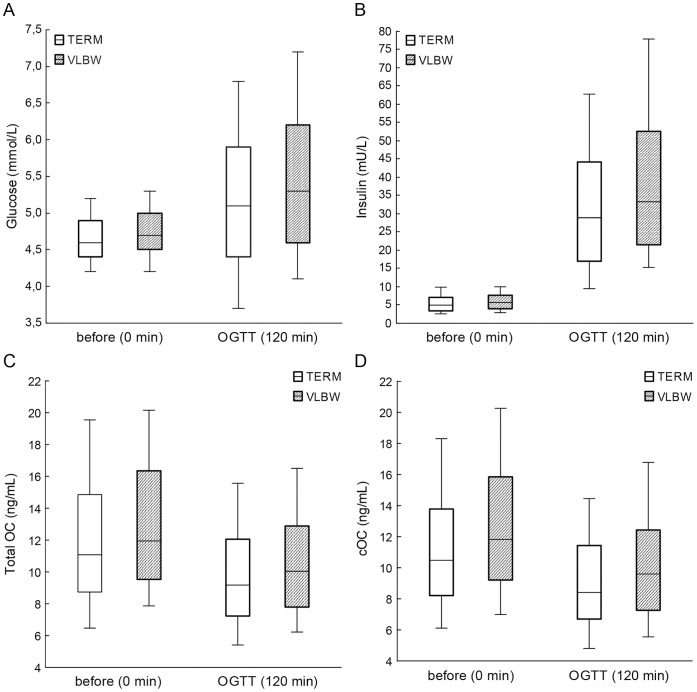
Figure 1. Glucose (A), insulin (B), total osteocalcin (C) and carboxylated osteocalcin (D) before and after 2-hour oral glucose tolerance test in term and VLBW subjects.
The lines inside the boxes represent the 50th percentile; the limits of the boxes represent the 25th and 75th percentiles, and the whiskers represent the 10th and 90th percentiles.

