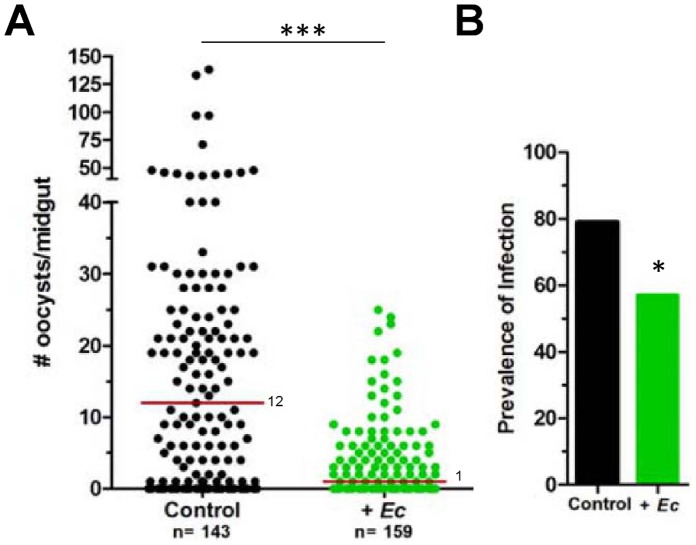
Figure 4. E. cloacae inhibits P. falciparum development in An. stephensi.
(A) Mosquitoes were fed on a P. falciparum gametocyte culture mixed either with medium alone (control) or with E. cloacae (+Ec; at a final concentration of 1×10⁶/ml). After 8 days, oocyst numbers were counted by mercurochrome staining of dissected midgut samples and the data were pooled from four independent experiments. Median oocyst numbers are depicted by the red line and the P-value was determined using a Mann–Whitney U test. The total numbers (n) of mosquitoes analyzed are denoted below each sample. The percentage of mosquitoes containing at least one P. falciparum oocyst (or prevalence of infection) is shown in (B). Samples were analyzed by Chi-squared analysis to determine significance. P-values are denoted by asterisks (* = P<0.05; *** = P<0.001).

