
Figure 1. Bar plot of genetic ancestry estimates from STRUCTURE software (percent European, African, and Native American) in CHAMACOS children (n = 375).
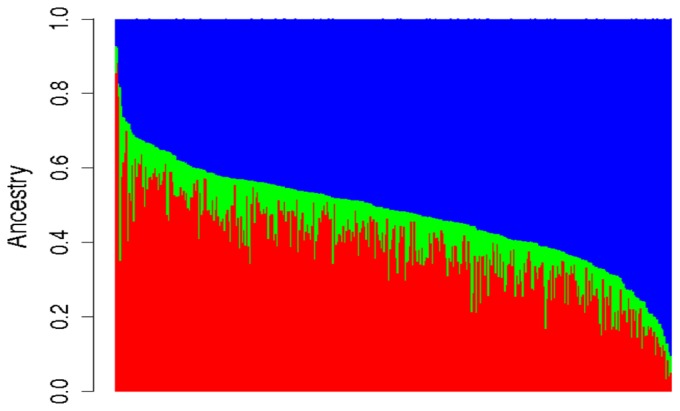
The red, green, and blue lines represent proportional European, African, and Native American ancestry, respectively.