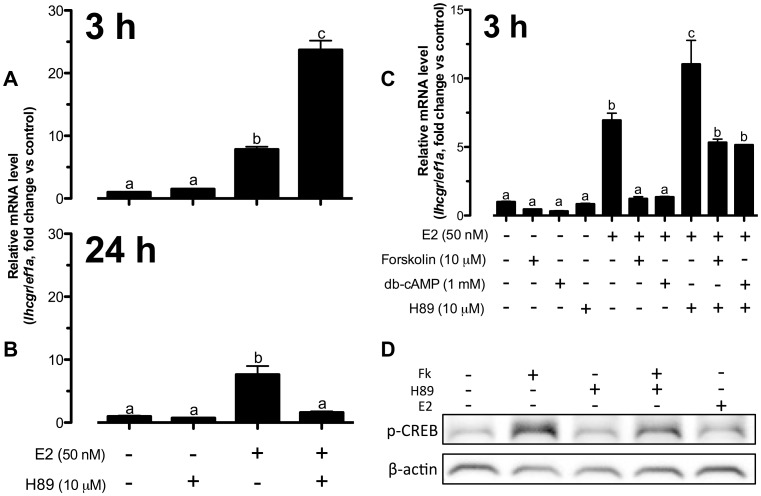
Figure 2. E2-induced lhcgr expression was dependent on cAMP-PKA without direct PKA activation in zebrafish follicle cells.
(A–C) The cells were pretreated with H89 (10 µM) for 15 min followed by treatment with E2 (50 nM), forskolin (10 µM) and db-cAMP (1 mM) for 3 h or 24 h before the end of the 24-h treatment period. The data were expressed as fold change compared to the control group after normalization to the expression of ef1a. Different letters in each data set indicated statistical significance (P<0.05; mean ± SEM, n = 3–6). (D) The cells were pretreated with H89 (10 µM) for 15 min followed by treatment with E2 (50 nM) and forskolin (10 µM) for 30 min before the end of the 24-h treatment period. Cells were lyzed in SDS sample buffer for Western blot analysis of phospho-CREB (p-CREB) and β-actin expression.

