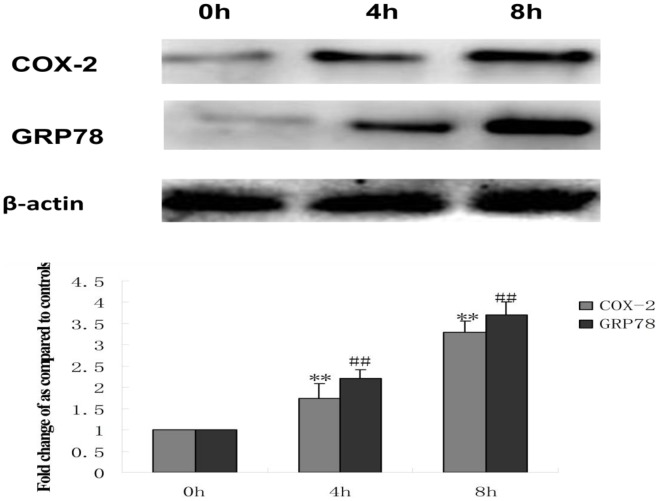
Figure 4. Effect of tunicamycin treatment on the expression of COX-2 and GRP78 in HepG2 cells.
HepG2 cells were treated with 3 µmol/L tunicamycin (TM) for 0 (control), 4 and 8 hr. Equal protein amounts of cell lysates were subjected to western blot assay using specific anti-COX-2 and anti-GRP78 antibody. β-actin in the same HepG2 cells extract was used as an internal reference. Optical density reading values of the specific protein versus the loading control protein β-actin are represented as fold of the control values. (**P<0.01, ##P<0.01,compared with untreated HepG2 cells).

