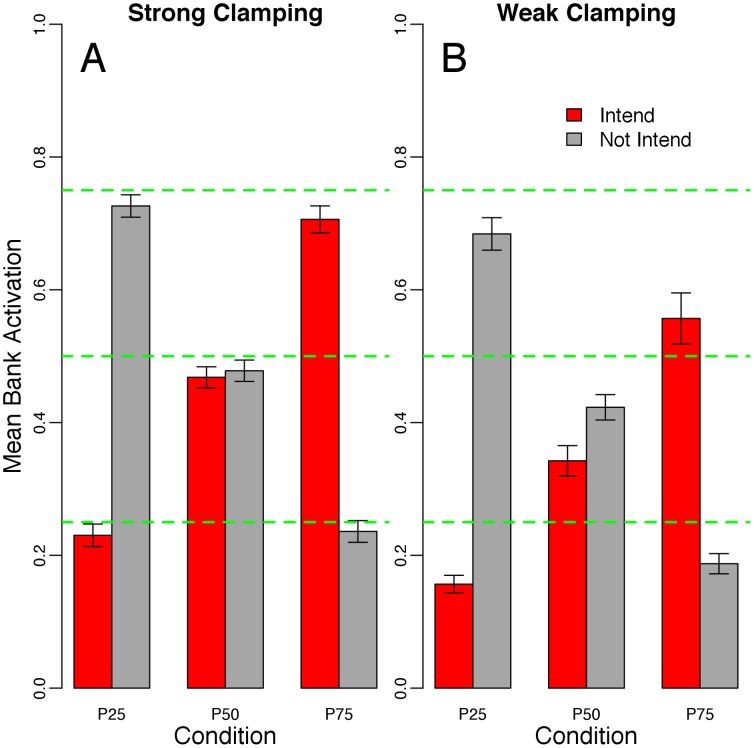
Figure 3. The results from Simulation I.
The x-axis shows the three input set conditions: P25, P50, and P75. The y-axis represents the mean activation of each valence bank (red = positive, to intend; grey = negative, to not intend). The green dashed-horizontal lines indicate mean activation levels of 0.25, 0.50, and 0.75. The error bars show the standard deviation across 30 runs of each input set X clamping factor condition (using n = 30 in the denominator). Panel A shows the strong clamping condition; Panel B shows weak clamping.

