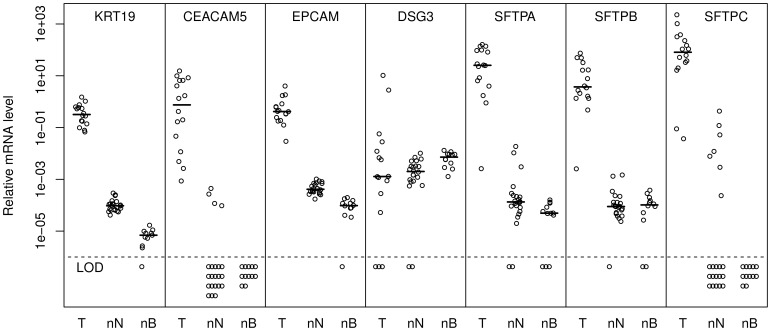
Figure 1. Relative marker levels in non-small cell lung cancer (NSCLC) tumors (T), normal LNs (nN) and peripheral blood samples (nB).
Median values are indicated by short horizontal lines, whereas samples with levels below the limit of detection (LOD) are indicated below the dashed horizontal line. The levels of the different markers are relative to a calibrator sample and not directly comparable.

