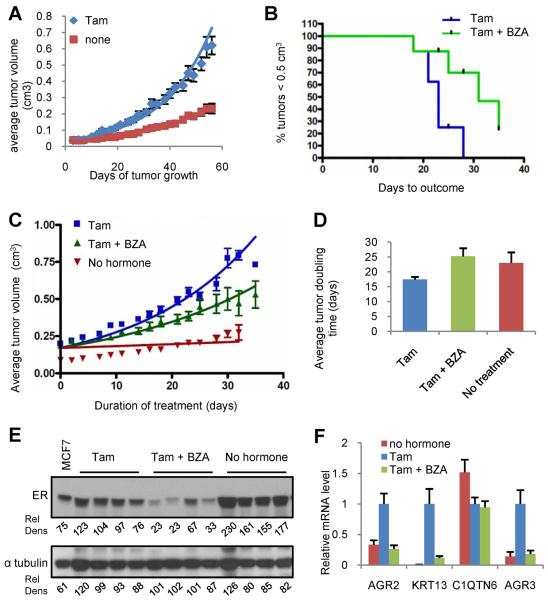
Figure 3. BZA attenuates ER dependent growth of tamoxifen resistant breast tumor xenografts.
A) Average tumor volume of tamoxifen resistant xenograft tumors implanted with or without tamoxifen stimulation (5 mg sc pellet). B–D) When Tam stimulated tumors attained 0.2±0.025cm3 tumor volume, animals were randomized (8–10 mice per group) to receive continued tamoxifen stimulation (tam alone) or treatment with Tam together with BZA (5mg sc pellet). B) Days required for tumors in each group to reach 0.5 cm3 volume (Kaplan Meier analysis). Logrank test indicated significant difference (p=0.0175). C) Tumor growth for each group is presented as average tumor volume +/− SEM per study arm at each day of treatment, with the initial day of treatment at randomization considered to be day 0. Tumor volume for the unstimulated (no hormone) group is plotted corresponding to the first day of treatment for the +/− BZA groups. Non-linear regression analysis for each growth curve is presented D) Average doubling time for tumors in each group. Data for each replicate was fitted to an exponential growth regression model [Y=Start*exp(K*X), where we constrained the Start to being shared between all groups]. Doubling time was estimated from these curves and plotted as mean +/−SEM. Non-parametric Mann Whitney test indicated a significant difference (P=0.0207) between Tam and Tam+BZA. E) ER expression detected by immunoblot of whole cell extracts of tumors harvested from four representative mice from each group. Relative density (Rel Dens) was calculated as in Figure 2. F) Average expression level (+/− SEM) of tamoxifen regulated genes in tumors (n=8–10) from each treatment group. mRNA levels were detected and normalized to human 36B4 as in Figure 1. Data are plotted relative to the tamoxifen treated group.
Graph – exp 558

