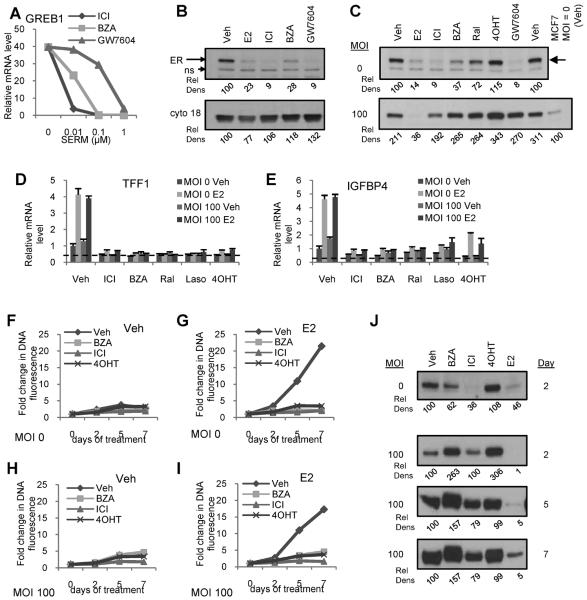
Figure 5. BZA dependent inhibition of ER-mediated transcriptional activity is not impacted by loss of ER turnover.
A) MCF7 cells were treated for 24 hours with or without E2 (1nM) in the presence of the indicated SERDs (0.01–1 μM). mRNA expression of target gene GREB1 was detected as in Figure 1. B) MCF7 cells were treated for 24 hours with E2 (100nM) or SERDs (1μM) and ERα levels were analyzed by immunoblot. C–E) MCF7 cells were infected with ERα adenovirus (MOI 100) or mock infected prior to 24 hours treatment with E2 (100 nM) or other ligands (1μM). C) ERα levels were analyzed by immunoblotting of whole cell extracts. D–E) Expression of ER target genes in cells infected in parallel and treated 24 hours with E2 (10 nM) in the presence or absence of SERMs or ICI (1 μM) was analyzed by RT-qPCR as in Figure 1. F–G) MCF7 cells were infected as in C and treated with ligands (1μM) in the presence or absence of E2 (1nM) immediately, and 2 and 5 days following infection, with one replicate plate harvested prior to infection and 2, 5, and 7 days after infection. Cell proliferation in the absence (left) or presence (right) of estrogen was analyzed as in Figure 1. H) MCF7 cells were infected, treated with ligands, and harvested in parallel with F and G. ERα expression was analyzed as in C. Data are representative of at least 3 independent experiments. Relative density (Rel Dens) of blot images was calculated as in Figure 2, but normalized to, and expressed as a percentage of, the density detected for the vehicle treated control. For 5C, values are normalized to, and expressed as a percentage of, the vehicle treated uninfected sample. In 5H, values are normalized to, and expressed as a percentage of, the vehicle control for each MOI and time.

