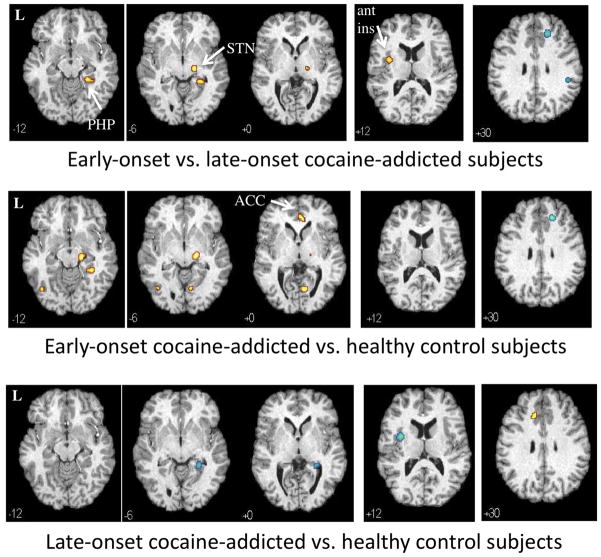
Fig. 3.
Differences in regional cerebral blood flow (rCBF) changes in response to ondansetron relative to saline (p<0.001) in 10 early-onset (top panel) vs. 10 late-onset (middle panel) cocaine-addicted participants (top panel), early-onset vs. 22 control (middle panel) and late-onset vs. control (bottom panel) participants. Yellow areas display voxels with greater rCBF response to ondansetron in the first listed group relative to the second; blue areas are voxels with decreased rCBF response in the first listed group relative to the second. MNI coordinates (z-axis) noted at the bottom left of each image. L = left. PHP = parahippocampus. ACC = anterior cingulate cortex. ant ins = anterior insula. STN = subthalamic nucleus. See Supplement 4 (early-onset vs. late-onset), Supplement 5 (early-onset vs. controls) and Supplement 6 (late-onset vs. controls) for all transverse images.

