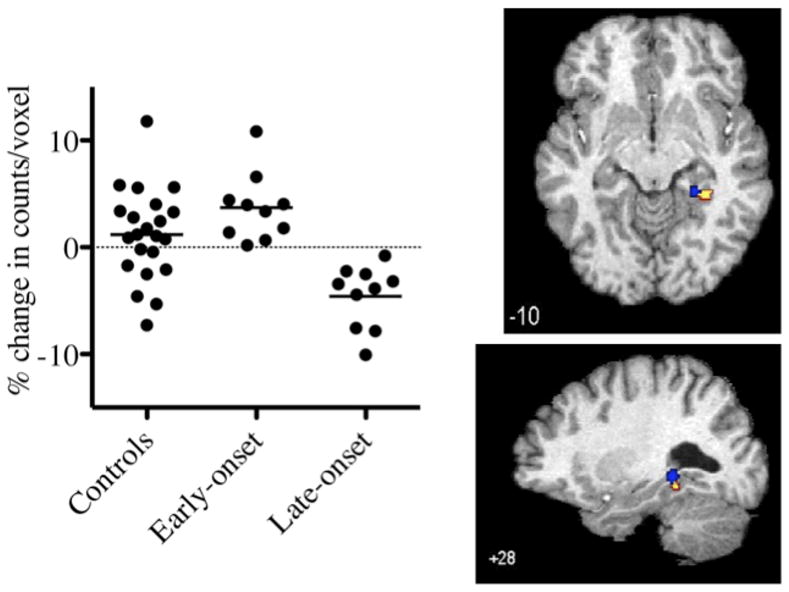
Fig. 4.

Percent change in counts per voxel following ondansetron, relative to saline, in right parahippocampal (PHP)/hippocampal (HP) gyri region in control and early- and late-cocaine addicted participants (left panel). There was a significant group difference in counts/voxel (F = 13.32, p < 0.001). Right panel displays transverse (top) and sagittal (bottom) image of overlapping clusters. Region encompasses overlapping PHP/HP clusters of increased (yellow cluster) and decreased (blue cluster) rCBF identified in Fig. 1 (upper and middle panel, respectively). MNI coordinates noted at the bottom left of each image.
