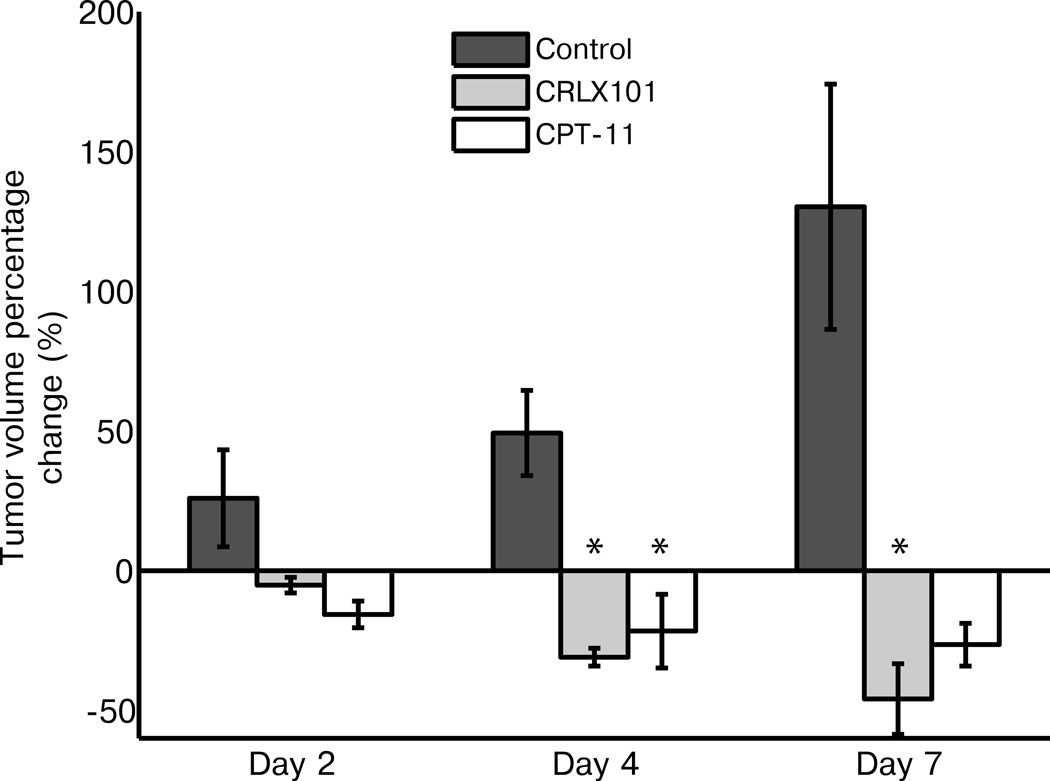
Figure 3.
Tumor volume size changes over treatment week. Mean tumor sizes, as measured from anatomical MRI images, are graphed for the three different treatment groups over one week post treatment. Compared to controls, CRLX101 tumor sizes significantly decreased on both day 4 and 7 (p < 0.01, *). In comparison, CPT-11 group tumor size changes were only significantly different to the control group on day 4 (p < 0.01, *). Error bars denote standard error.

