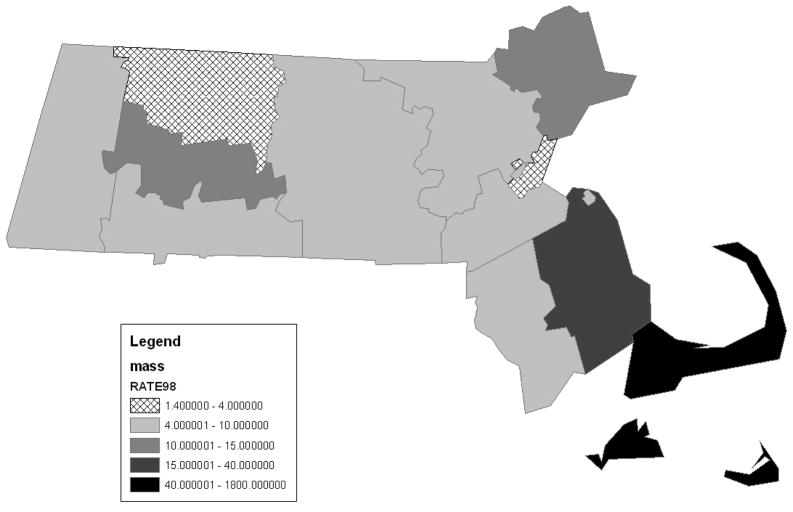
Figure 1.
This map of Massachusetts shows the average incidence (# of cases per 100,000 people) of Lyme disease by county over a three year period. It displays the data used to measure the risk associated with home location for patients who presented with facial palsy to the pediatric emergency department in the year following this three year interval.

