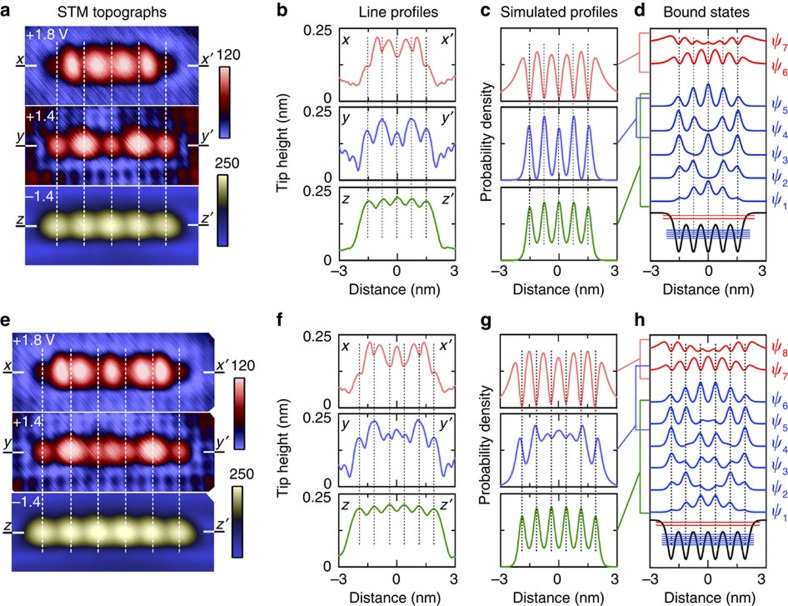
Figure 6. Linear chains of five and six DBs.
(a) STM topographs of the five-DB chain at +1.8, +1.4 and −1.4 V, respectively (15 pA; 4.5 × 2 nm2). (b) Line profiles taken along the DB structures as indicated for each of the images in a. (c) Simulated line profiles generated from linear combinations, Σci|ψi|2, of the individual bound-state solutions to the five-DB system. (d) Five-DB potential well and the probability distributions of its bound-state wavefunctions, ψ1 to ψ7 with binding energies given in eV. (e–h) Repeat of panels a–d for a six-DB chain (images are 5.3 × 2 nm2). The coefficients ci were calculated using ci=e−Ei/α where α=0.15 and 0.3 for filled and empty states, respectively, and Ei is the binding energy of the i-th state. For the low empty-state bias (+1.4 V) simulation of the five-DB, only contributions from ψ4 and ψ5 were included, whereas for the six-DB states ψ5, ψ6 and ψ7 were included with c7=1.5c6 (see text).

