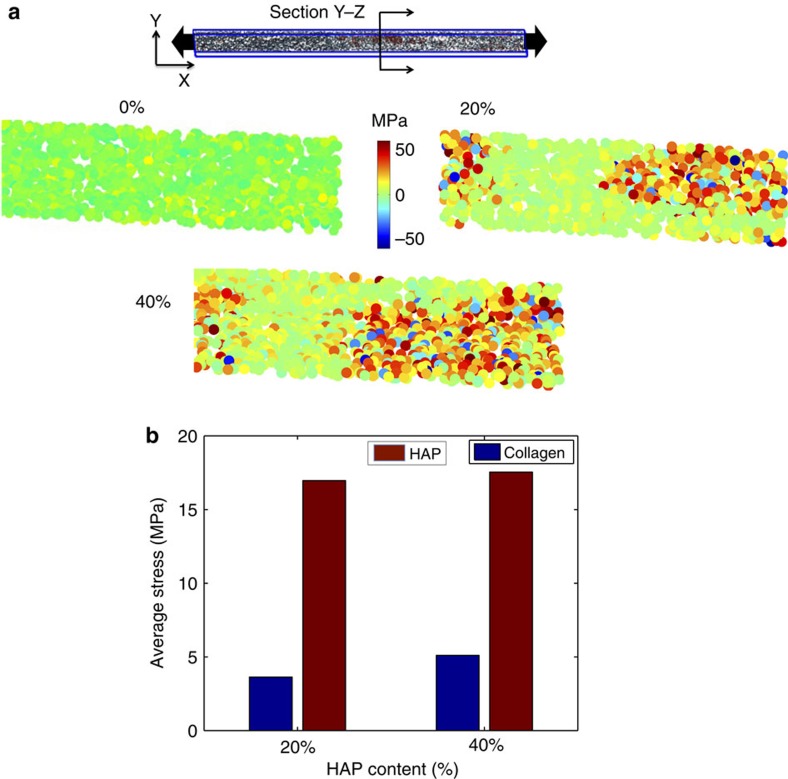
Figure 6. Analysis of stress fields for different mineral contents.
(a) View of the cross-section of the y–z plane of the unit cell used to perform the stress analysis. The principal stress contours for an applied stress of 100 MPa in collagen microfibril show a nearly uniform stress distribution, whereas the data for 20 and 40% mineral-density cases clearly reveals significantly higher stress regions in the HAP mineral. (b) Quantification of the overall average stress in the collagen and mineral phases at 100 MPa applied stress, showing that the mineral phase features about four times the stress level compared with collagen.

