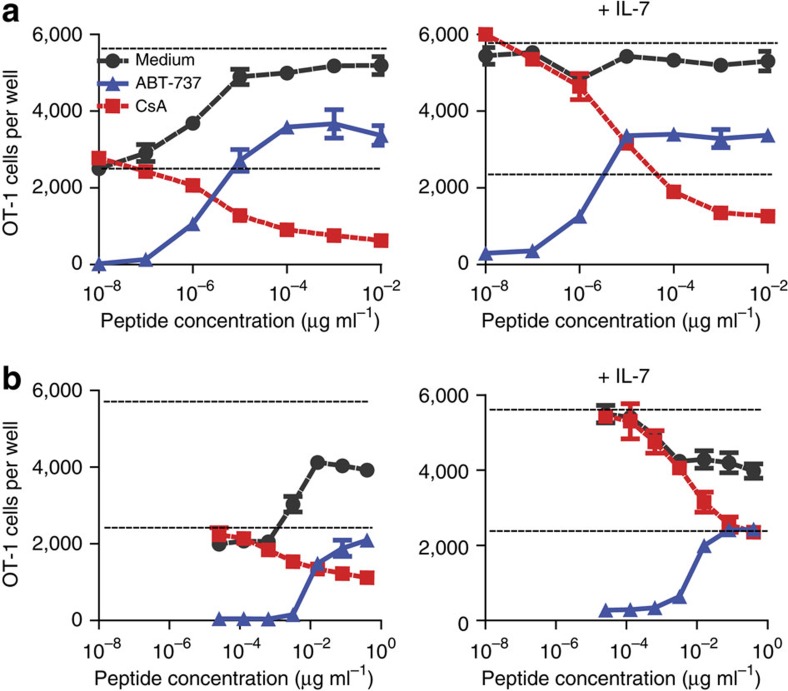
Figure 3. A switch in survival regulation after TCR stimulation.
Effects of CsA and ABT-737 on the survival of OT-1 CD8+ after antigen stimulation were measured. OT-1 CD8+ were stimulated for 22 h with (a) N4 (10−8–10−2 μg ml−1) or (b) V4 (2.6 × 10⁻⁵ to 4 × 10⁻¹ μg ml−1) in the presence of 1 μg ml−1 CsA or 10 μM ABT-737 in medium (left panels) or in 1 ng ml−1 IL-7 (right panels). CsA was added at the start of culture, whereas ABT-737 was added 6 h after beginning of culture. Data show number of viable cells per well. Horizontal dotted lines represent number of live cells without stimulation in medium (lower line) or 1 ng ml−1 IL-7 (upper line). Data are presented as means±s.e.m. of triplicate cultures.

