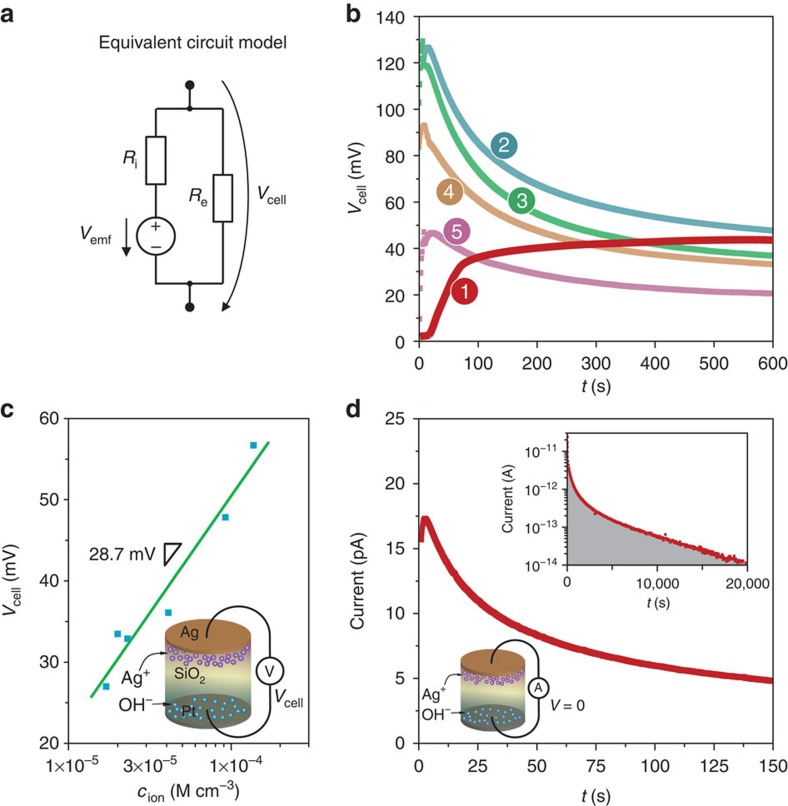
Figure 2. Steady-state emf measurements for Ag/SiO2/Pt ECM cells.
(a) Simplified equivalent circuit model of a ReRAM device. (b) Vcell for a Ag/SiO2/Pt cell measured under open circuit conditions. The red line curve (1) depicts Vcell in the OFF state after a SET/RESET cycle. For the other curves, the ion concentration cion (that is, the sum of the Ag+ and OH− ion concentrations, averaged over the thickness) was controlled and preset using different sweep rates25. Curve (2) corresponds to cion=1.4 × 10⁻⁴ M cm−3, (3) to cion=9.2 × 10⁻⁵ M cm−3, (4) to cion=2 × 10⁻⁵ M cm−3 and curve (5) to cion=1.7 × 10⁻⁵ M cm−3, respectively. Details of the measurements are depicted in Supplementary Fig. S2. Further voltage sweeps in the negative voltage regime result in further decrease of the ion concentration (Supplementary Fig. S3). (c) The slope of the line provides the pre-exponential term and we were thus able to determine the ionic transference number  by using equations (10) and z=+1 (for Ag+). (d) The time evolution of the discharge current (for V=0 V) of the cell (diameter d=100 μm) after SET and subsequent RESET operation is shown. Inset: the same plot for an extended time and a log current scale. The integration reveals the charge (5 nC) of the nanobattery.

