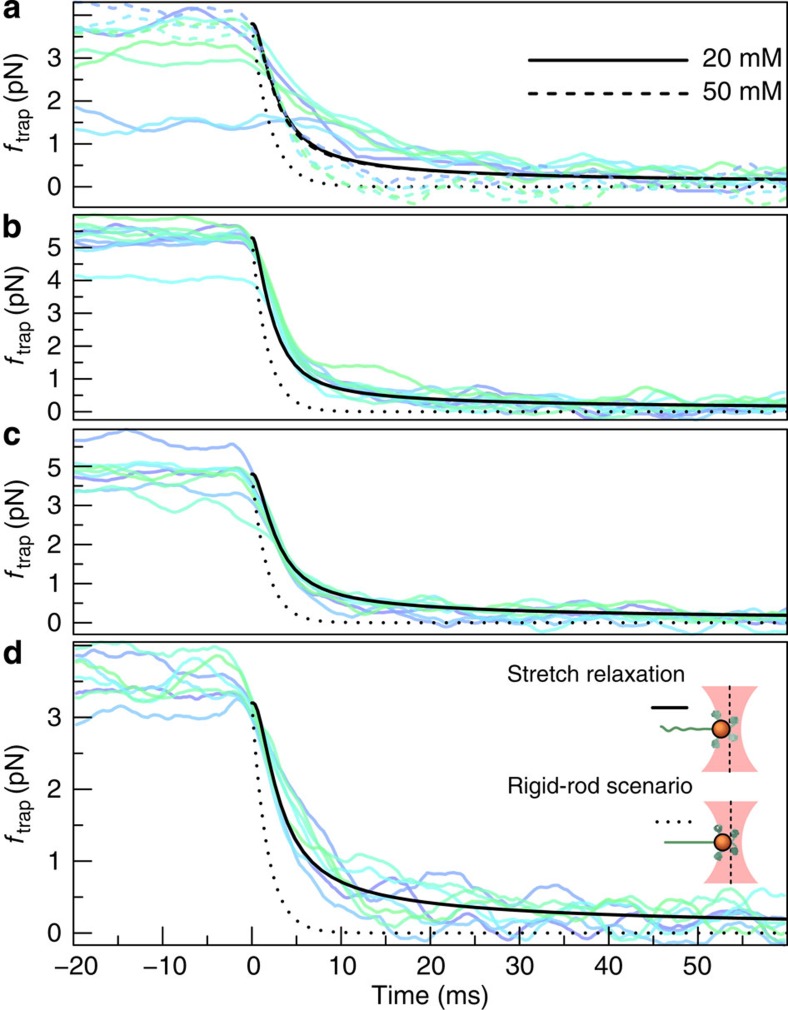
Figure 3. The time-dependent force ftrap(t) on the bead (deduced from the position of the bead in the tweezers).
Apart from the (small) friction force  onto the bead itself, ftrap(t) can be identified with the force fP(L,t) exerted by the stretched polymer onto the bead. Experimental data were obtained from 36 independent single-molecule measurements (moving average over 5 ms) at five different KCl concentrations c=20, 50 mM (a, 10 traces), c=100 mM (b, 10 traces), c=500 mM (c, 8 traces), c=750 mM (d, 8 traces). Theory curves: ftrap(t) including the dynamic backbone tension of the recoiling polymer and the bead drag (solid line), using a concentration-dependent persistence length of
  ,
,  ,
,  ,
,  ,
,  (33), and a friction coefficient per length
  ; for comparison, the prediction for the hypothetical rigid-rod scenario from Fig. 1c (dotted) is also shown. At low salt concentrations (a) the surface charge of the capillaries has a significant influence on the ionic current34 and the observed relaxation characteristics exhibit a larger variability. Alternative plots with theory curves for
  (independent of the salt concentration) are shown in Supplementary Fig. S1. A replication of the experiment using a different measurement protocol is documented in Supplementary Fig. S2.

