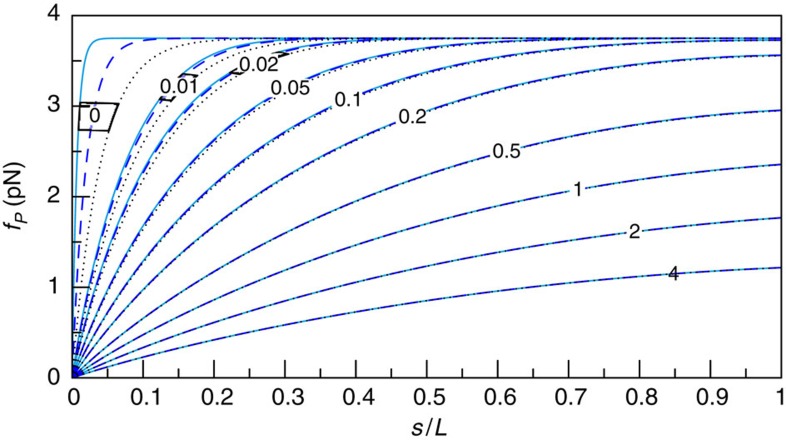
Figure 4. Evolution of the backbone tension along the polymer.
Numerical solutions of equation 4 for a set of three different initial conditions (corresponding to boundary layer widths of about 1, 2 and 4 μm coloured cyan, blue (dashed) and black (dotted), respectively) at various times t (in ms). The tension profiles quickly converge from their different initial states and settle onto a unique scaling function  with a slowly decaying amplitude, rendering the tension at the bead-laden end independent of the precise initial condition.

