
Figure 6. Analytical approximation versus exact numerical theory.

The dimensionless parameters α and χ denote polymer size and trap stiffness, respectively; see equations 6 and 7. All insets show the (reduced) time-dependent force 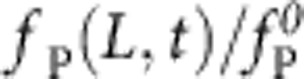 exerted by the polymer on the tracer bead over (reduced) time t/t0: numerical solution (solid lines), equation 1 (cyan dashed), pure release approximation neglecting the bead motion (blue). The analytical formula, equation 1, is generally accurate, with the exception of a narrow region χ>1, 1<α/χ<8, here delineated by the dashed white line, where the exact solution deviates by more than
  from the approximate result within the fitting interval.