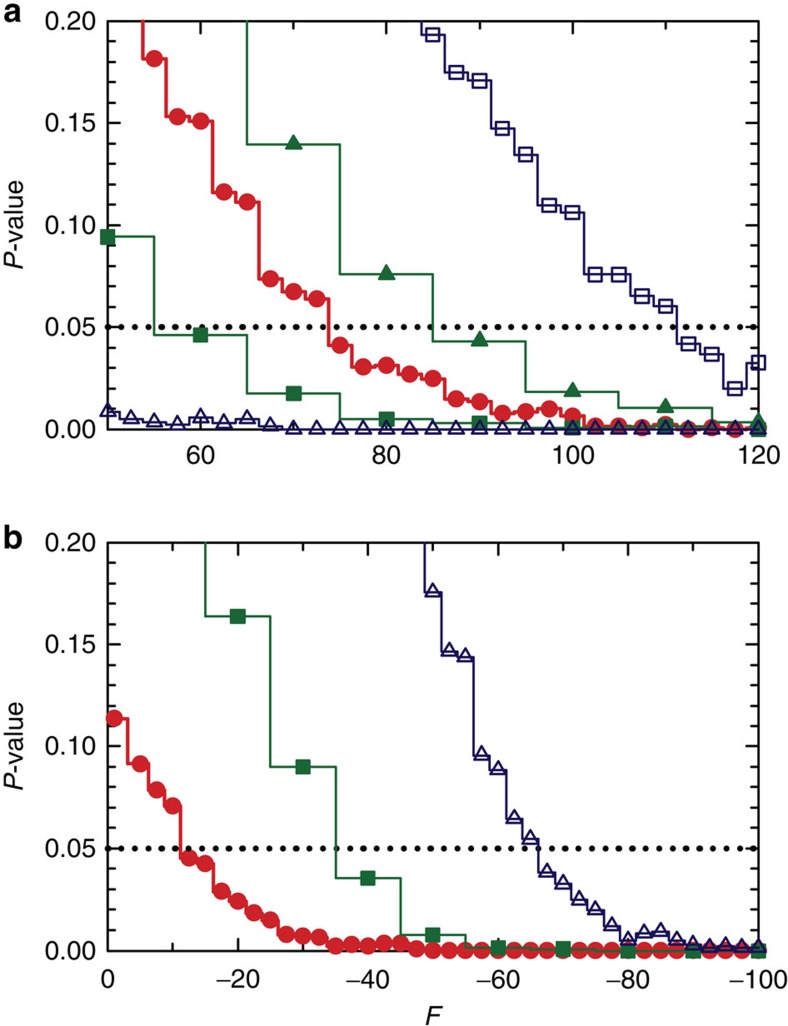
Figure 5. Monte Carlo analysis.
Estimated P-values for the combined test statistic Φ as a function of F for (a) gravitational interactions (F>0), and (b) anti-gravitational interactions (F<0). The probabilities are computed using a Monte Carlo study of the Fisher combined statistic, as discussed in the Methods. The red solid circle lines assume no systematic errors; the blue hollow square line assumes a detector displacement of −5 mm; the green solid triangle line assumes an octupole axis displacement of +0.05 mm; the green solid square lines assume an octupole axis displacement of −0.05 mm; the blue hollow triangle lines assume a detector displacement of +5 mm. (For (b), the P-values for a detector displacement of −5 mm or for an octupole axis displacement of +0.05 mm are essentially zero.) These four systematic errors encompass the range allowed by mechanical constraints.

