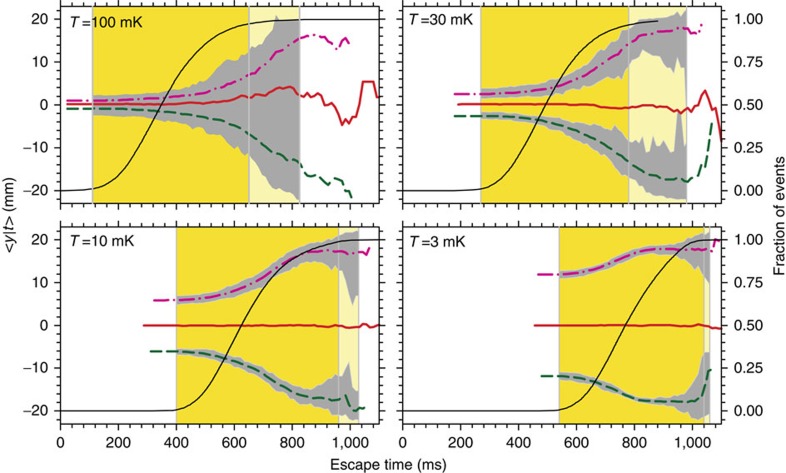
Figure 6. Cooled antihydrogen analysis.
The reverse cumulative averages 〈y|t〉 for antihydrogen atoms cooled to the temperatures T listed in each graph. The magnet shutdown has been slowed by a factor of ten. The magenta dash-dot line is for F=−1, the red solid line is for F=0, and the green dashed line is for F=+1. The dark yellow vertical band indicates the region in which the signal-to-cosmic-noise ratio (S/N) exceeds 5 for the current trapping rate 31, and the light yellow vertical band indicates this same region (S/N>5) for an antihydrogen trapping rate ten times greater. The grey bands demark the 90% confidence region (95% when interpreted as a one-sided confidence test) for 500 annihilations around the gravity and antigravity 〈y|t〉; for simplicity, these bands are not plotted for F=0, and are only plotted within the regions of the high S/N bands. The thin black solid line shows the fraction of anti-atoms that have escaped as a function of time. Only counting statistics and signal-to-cosmic-noise effects are included in this graph; systematic effects at low F need to be further investigated.

