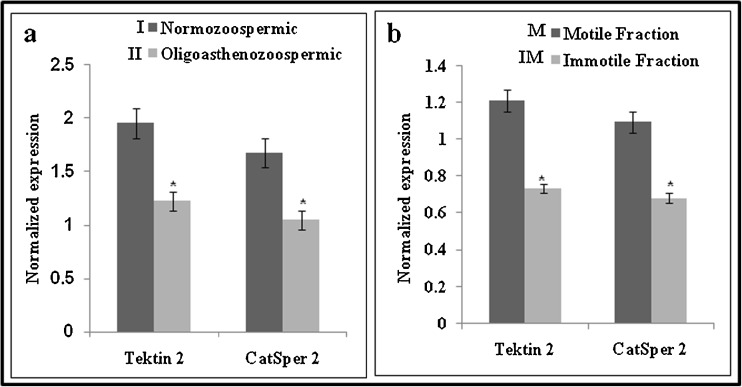
Fig. 2.
Association of Tektin 2 and CatSper 2 levels in spermatozoa of normozoospermic (n = 52) and oligoasthenozoospermic (n = 52) men (a) and Association of Tektin 2 and CatSper 2 levels in motile (n = 20) and immotile (n = 20) spermatozoa from normozoospermic men (b). The values on the Y axis are Mean ± SE of the Tektin 2 and CatSper 2 values normalized to β actin. * indicates values significantly different (p < 0.001)

