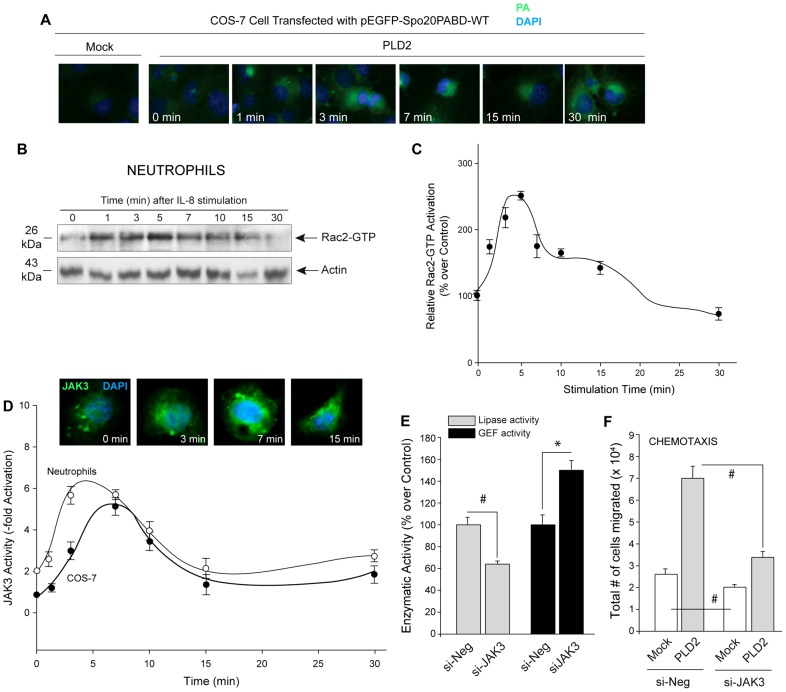
Fig. 7.
PA, Rac2-GTP and JAK3 as a function of time. (A) The panels show immunofluorescence of PA sensor (as reported in Frondorf et al., 2010) in COS-7 cells following EGF stimulation for increasing time. For PA sensor, cells were transfected with pEGFP-Spo20PABD-WT, which encodes for a fluorescent PA sensor consisting of EGFP fused to a 40 amino acid PA binding domain from the yeast Spo20 protein. Two days post-transfection, cells were treated with EGF for increasing time points. Cells were fixed to coverslips, the nuclei were stained with DAPI and cells were imaged using fluorescent microscope. PA accumulates at ∼3 min and then it increases with time, peaking at 15 min. Shown is a representative experiment among three performed with similar results (B) PBD-pulldown western blot showing Rac2-GTP levels upon IL-8 treatment of neutrophils for increasing time points. Result shown in B are representative of three experiments. (C) Densitometry line graph indicating Rac2-GTP levels measured by PBD pulldown (experiments performed in B). C is an average of three different experiments (D) JAK3 enzymatic activity was measured as indicated in the Materials and Methods section in COS-7 cells (closed circles) and neutrophils (open circles) that were stimulated with EGF or IL-8 respectively for the lengths of time indicated. Inset in D shows JAK3 localization in COS-7 cells upon EGF stimulation for the indicated time points. Results shown are representative of three different experiments. Fig. 7D was best fit by the Weibull (peak) distribution, 4-parameter equation. (E) Lipase and GEF activities of PLD2 are reduced and enhanced respectively (at 7 min after IL-8 stimulation) when JAK3 is silenced in dHL-60 cells. Cells were silenced with Negative-siRNA (si-Neg) or siJAK3. Immunoprecipitated PLD2 from these cells was used for GEF assays (the smaller the bars, the higher the GEF activity). (F) dHL-60s were silenced with Negative-siRNA or siJAK3, which was followed on the next day by overexpressing PLD2 (or they were mock-transfected). After a total of 4.5 days after the initial DMSO induction of differentiation, cells were taken for transwell assays for measurement of chemotaxis against IL-8. Triplicate results are means±s.e.m. and are expressed in terms of relative [3H]-GDP dissociation. *denotes significant differences (P<0.005) above controls; #denotes significant differences (P<0.005) below controls.

