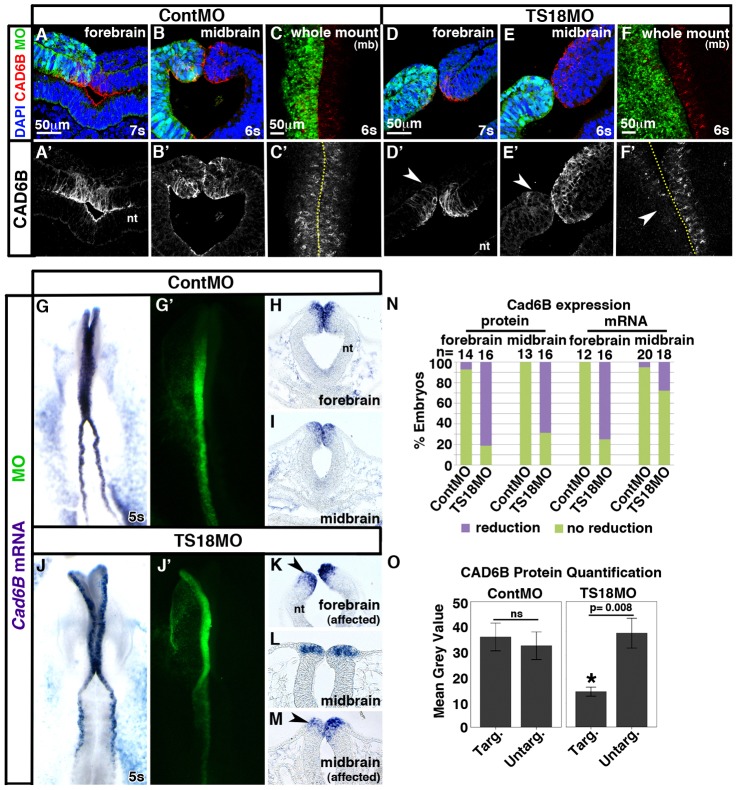
Fig. 2.
Tspan18 knockdown leads to a reduction in Cad6B protein levels with variable effects on Cad6B mRNA expression. (A–F) Transverse sections (A,B,D,E) and whole mount images (C,F; midbrain dorsal view) reveal that Cad6B immunofluorescence (A–F, red; A′–F′) is reduced on the targeted side of the neural tube (green) in the forebrain (arrowhead in D′) and midbrain (arrowheads in E′,F′) of embryos at 6–7 somites unilaterally electroporated with TS18MO (D–F) but not with ContMO (A–C). (G–M) Whole mount in situ hybridization (G,J; dorsal view, anterior embryo half) and transverse sections (H,I,K,L,M) reveal that Cad6B mRNA expression (purple) is reduced on the targeted side (green) compared with the untargeted side in the forebrain (arrowhead in K) but is unaffected in the midbrain of the majority of TS18MO-electroporated embryos (L). In 27.8% of embryos, Cad6B mRNA was reduced in neural folds electroporated with TS18MO (arrowhead in M). (N) Bar graph representing the frequency of electroporated embryos exhibiting affected versus unaffected Cad6B protein levels or mRNA expression. (O) Quantification of Cad6B immunofluorescence intensity comparing the MO-targeted (targ) and untargeted (untarg) sides of the midbrain neural tube in individual sections (n = 5). nt, neural tube; mb, midbrain; ns, not significant. Dotted lines in C′,F′ indicate embryo midline. Scale bars: 50 µm (A,C,D,F).

