
Figure 3.
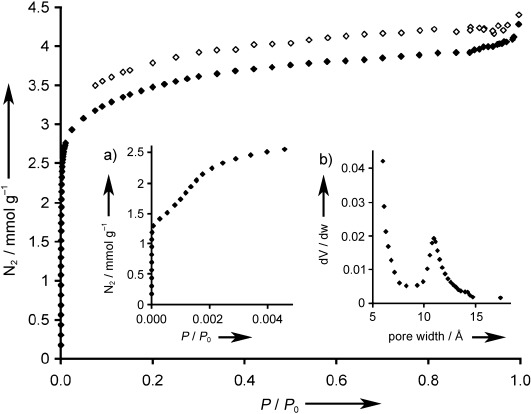
The nitrogen adsorption isotherm for crystals of 1 at 77 K (⧫ adsorption; ◊ desorption). The insets show a) an expansion of the low-pressure region of the isotherm showing the two distinct inflection points that correspond to nitrogen filling of the 4 Å channels and 11 Å voids and b) the pore size distribution calculated from the low-pressure adsorption data by using the Horvath–Kawazoe method.