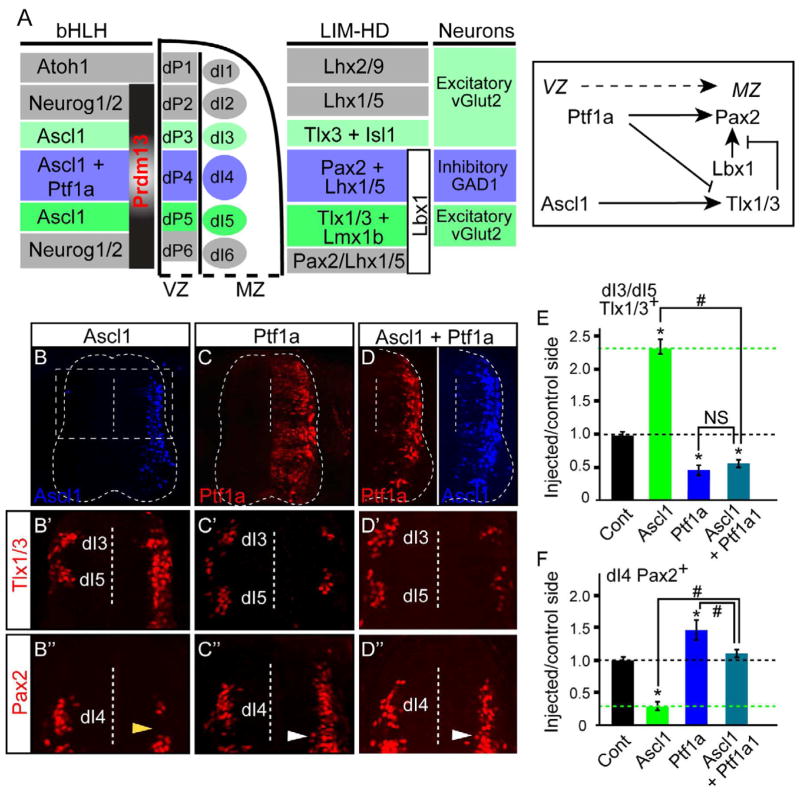
Figure 1. Opposing activities of Ascl1 and Ptf1a on neuronal subtype specification.
(A) Diagram showing the pattern and interacting network of bHLH and LIM-HD transcription factors in the dorsal spinal neural tube. (B–F) Stage HH12-13 chick embryos were electroporated with expression vectors for Ptf1a and/or Ascl1 and harvested at HH24-25. Transverse sections are shown with the electroporated side on the right. Ascl1 (B,D blue) and Ptf1a (C,D red) detects the ectopically expressed proteins. Dashed box in (B) is the region of the neural tube shown in (B′–D″). Dashed vertical line indicates the ventricle. (B′–F) Dorsal neural tube sections show the dI3 and dI5 neuronal populations marked by Tlx1/3 antibody (B′–D′), or dI4 marked by Pax2 (B″–D″). (E,F) the ratio of Tlx1/3+ or Pax2+ neurons on the electroporated side versus the control side showing that overexpression of Ascl1 causes a dramatic increase in Tlx1/3+ and decrease in Pax2+ neurons, while Ptf1a, or Ascl1 plus Ptf1a, causes the opposite. Note that ectopic Pax2+ cells (white arrowheads) are found in the dI5 domain not normally expressing Pax2 (yellow arrowhead). Error bars are reported as SEM. p-values<0.001 between sample and control (*) or between samples (#). NS, not significant. Supplementary Fig. S1 shows Lbx1 also induces Pax2 (associated with panel A).

