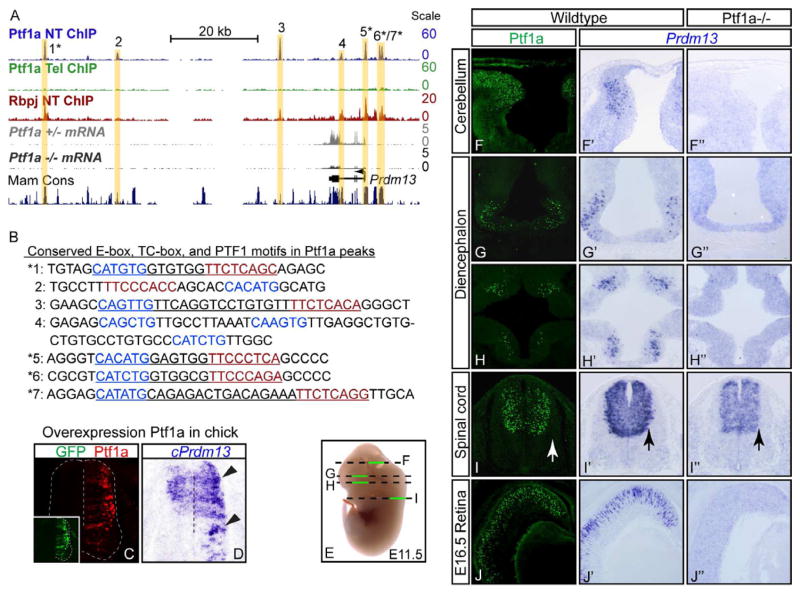
Figure 2. Prdm13 is a direct downstream target of Ptf1a.
(A) The mouse genomic region surrounding Prdm13 showing ChIP-Seq for Ptf1a from E12.5 neural tube (blue) and telencephalon (green) or Rbpj from neural tube (red), and RNA-Seq from FACS isolated Ptf1a lineage cells from E11.5 Ptf1a+/− (gray) or Ptf1a−/ − embryos (black). Seven Ptf1a peaks are highlighted with yellow bars. The location of the Prdm13 transcript is shown, as is a histogram of mammalian conserved regions (UCSC Genome Browser). (B) Sequence under the apex of each Ptf1a ChIP-Seq peak. DNA regions 1–7 showing the E-box (blue), TC-box (red), and the PTF1 motifs (underlined). * peaks that are conserved from mouse to zebrafish and contain the consensus PTF1 motif. (C–D) Overexpression of mouse Ptf1a (C, red) in chick neural tube induces cPrdm13 mRNA (D, arrowheads). Inset: GFP indicates the electroporation efficiency. (E) Diagram of section planes for images shown in (F–I). (F–J″) Cross sections of mouse E11.5 ore E16.5 show Ptf1a protein (F–J), and Prdm13 mRNA in wildtype (F′–J′) and Ptf1a−/ − (F″–J″). Note in cerebellum, diencephalon, and retina Prdm13 is lost in the Ptf1a mutant, but in the spinal cord, only the lateral domain that reflects the Ptf1a pattern is lost (arrows). Supplementary Fig. S2 includes expression data for Ptf1a and Prdm13 in the neural tube at additional embryonic stages and genomic coordinates for Ptf1a peaks 1–7 from panel B.

