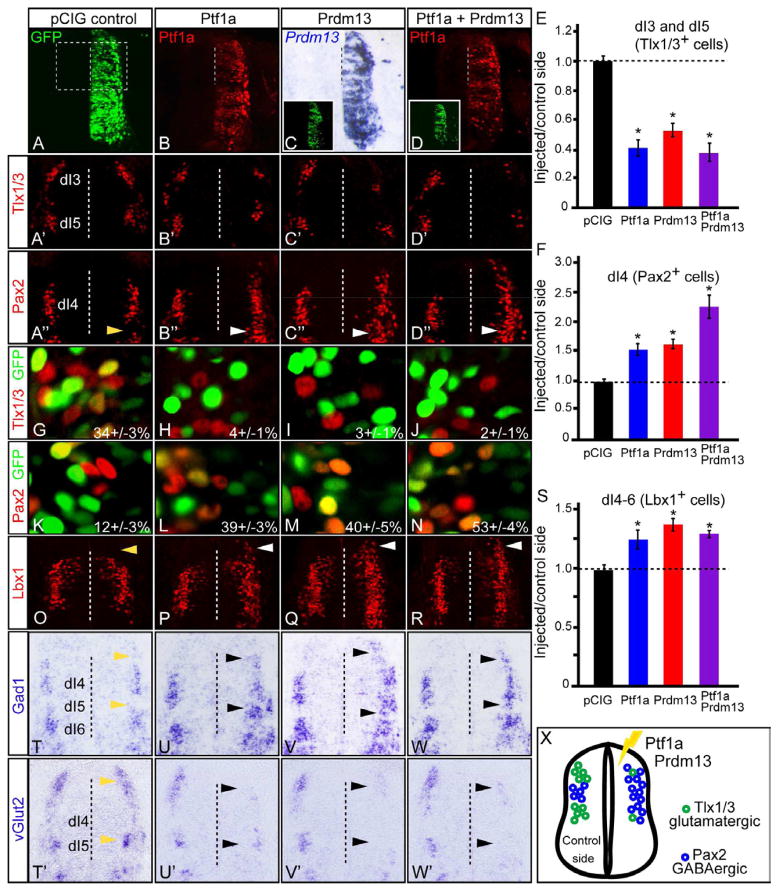
Figure 3. Ptf1a and Prdm13 induce inhibitory and suppress excitatory neuronal markers.
Stage HH12-13 chick embryos were electroporated with empty vector (control), Ptf1a, Prdm13, or both. Transverse sections through stage HH24-25 are shown with the electroporated side on the right. (A–D) GFP (green) shows electroporation efficiency along the dorsoventral axis. Ptf1a protein (red) and Prdm13 mRNA show ectopic expression. Dashed box in (A) is the region of the neural tube shown in (A′–D″, O–R). (A′–F) Dorsal neural tube sections from (A–D) indicate the dI3 and dI5 neuronal populations marked by Tlx1/3, or the dI4 neurons marked by Pax2. (E,F) the ratio of Tlx1/3+ or Pax2+ neurons on the electroporated side versus the control side showing that overexpression of Ptf1a and Prdm13 cause a dramatic decrease in Tlx1/3+ and increase in Pax2+ neurons relative to control. Note that ectopic Pax2+ cells (white arrowheads) are found in the dI5 domain not normally expressing Pax2 (yellow arrowhead). (G–N) Electroporated cells, visualized by GFP, co-localized with Tlx1/3 (G–J) or Pax2 (K–N). The percentage of GFP cells that co-express Tlx1/3 or Pax2 in the dorsal mantle zone is shown. Ectopic expression of Ptf1a and/or Prdm13 reduces the percentage of Tlx1/3;GFP double positive cells from 34% to 2–4%, and increases Pax2;GFP double positive cells from 12% to 39–53%. (O–S) Dorsal neural tube sections from (A–D) showing the dI4-6 neuronal populations marked by Lbx1. Quantification (S) showing that Ptf1a and Prdm13 overexpression cause an increase in Lbx1+ neurons relative to control. The white arrowheads indicate ectopic Lbx1 expression detected in the dI3 region not normally expressing Lbx1 (compare to control (O) yellow arrowhead). (T–W′) In situ hybridization with Gad1 or vGlut2 probes showing that Ptf1a and Prdm13 overexpression increase Gad1 and decrease vGlut2 (black arrowheads) when compared to either the empty vector control (yellow arrowheads) or the control side in each neural tube. (X) Diagram summarizing the overexpression phenotypes. Error bars are reported as SEM. * p-values<0.001. Supplementary Fig. S3 includes analysis of the Prdm13 phenotype with additional markers of the dorsal interneuron populations including Isl1/2, Lmx1b and Lhx1/5.

