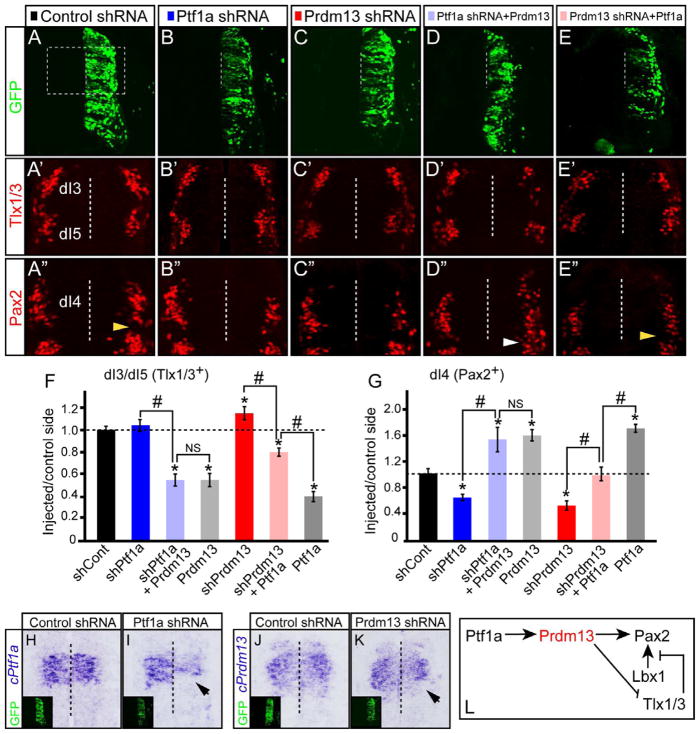
Figure 4. Ptf1a requires Prdm13 to specify inhibitory neurons and suppress excitatory neurons.
Stage HH12-13 chick embryos were electroporated with expression or shRNA vectors to modulate levels of Ptf1a and Prdm13. Transverse sections through stage HH24-25 are shown with the electroporated side on the right. (A–E) GFP indicates the electroporation efficiency along the dorsoventral axis. The dashed box is the region shown in (A′–E″). (A′–E′, F) Tlx1/3 shows Prdm13 knockdown results in an increase in dI3/dI5 neurons (C′). Epistasis experiments show Prdm13 does not require Ptf1a for this activity in repressing Tlx1/3 (D′) but Ptf1a activity is abrogated with shPrdm13 (E′). (A″–E″, G) Pax2 shows a significant decrease in the number of dI4 neurons when Ptf1a or Prdm13 are knocked down compared to control shRNA (B″, C″, G). Epistasis experiments show Prdm13 does not require Ptf1a for this activity in inducing Tlx1/3 (D″) but Ptf1a activity is abrogated with shPrdm13 (E″). Note that ectopic Pax2+ cells (white arrowhead) are found in the dI5 domain not normally expressing Pax2 (yellow arrowheads). Error bars are reported as standard error of the mean. p-values<0.001 between sample and control (*), and between samples (#). NS, not significant. (H–K) cPtf1a or cPrdm13 probes indicate the knockdown efficiency (arrows). Inset: GFP indicates the electroporation efficiency. (L) Diagram summarizing the conclusion that Prdm13 is a functional downstream target of Ptf1a that induces Pax2 and suppresses Tlx1/3. Supplementary Fig. S4 includes rescue control experiments for the shRNA.

