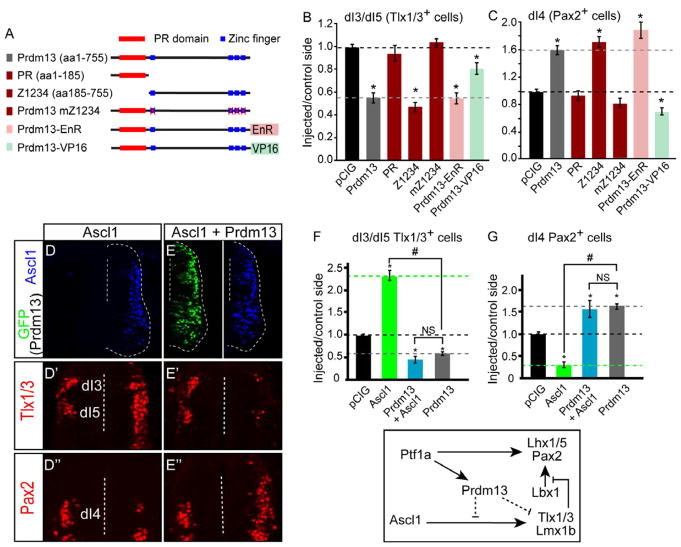
Figure 5. Prdm13 Blocks Ascl1 Activity through Repression Requiring Its Zn Fingers.
(A) Diagram of the Prdm13 mutations tested. PR domain (red boxes) and Zn finger domains (blue boxes) are indicated. Engrailed repressor (EnR) or activator VP16 were fused in frame at the C-terminal end of Prdm13.
(B-C) Quantification of experiments testing the Prdm13 mutants indicated. The black dashed line indicates the pCIG control ratio of injected/control side. The gray dashed line indicates the phenotype of the full-length Prdm13. The PR domain is dispensable for Prdm13 activity, but the four Zn fingers are required. The Prdm13-EnR fusion mimics the Prdm13 phenotype, whereas the Prdm13-VP16 does not.
(D-E”) Stage HH12-13 chick embryos were electroporated with Ascl1 (D) or Ascl1 plus Prdm13 (E). Transverse sections through stage HH24-25 are shown with the electroporated side on the right. Ascl1 detects the ectopically expressed protein (blue), and Prdm13 is indicated by GFP. Dashed lines indicate location of the ventricle. Dorsal neural tube sections from (D and E) show Tlx1/3 defining the dI3 and dI5 (D’-E’) and Pax2 defining dI4 neuronal populations (D”-E”). Ectopic Ascl1 causes a dramatic increase in the number of Tlx1/3+ neurons with a decrease in Pax2+ cells, whereas addition of Prdm13 reverses this phenotype.
(F-G) The ability of Prdm13 to block this activity of Ascl1 is quantitatively shown.
All error bars are reported as SEM. p values < 0.001 between sample and control (*), and between samples (#). NS, not significant. Diagram summarizing the conclusion that Prdm13 antagonizes Ascl1 neuronal subtype specification activity. Figure S5 shows Ascl1 expression levels are not altered by overexpression or knockdown of Prdm13. Additionally, representative images for Tlx1/3 and Pax2 for chick electroporation experiments with the Prdm13 truncations are shown.

