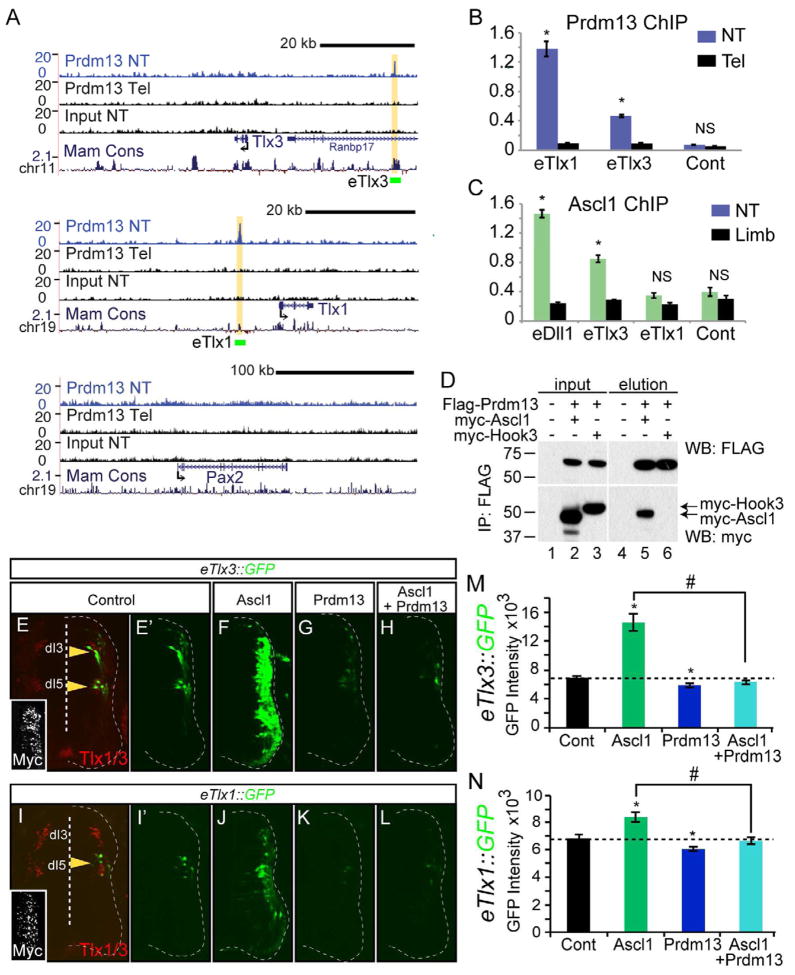
Figure 6. Prdm13 directly suppresses Tlx1 and Tlx3 through multiple mechanisms.
(A) UCSC Genome Browser showing mouse genomic regions surrounding Tlx3, Tlx1, and Pax2 including Prdm13 ChIP-Seq from neural tube (NT, blue), and two negative controls including Prdm13 ChIP-Seq from telencephalon (Tel) and input from NT, all from E11.5 mouse embryos. Prdm13 occupies chromatin near the Tlx1 and Tlx3 genes at sequence conserved across mammals (yellow highlight). Green bars labeled eTlx1 and eTlx3 are the regions used in the GFP reporter constructs in (E–N). (B) ChIP-qPCR validating Prdm13 ChIP-Seq at the eTlx1 and eTlx3 loci in (A). Tel tissue is negative for Prdm13 and serves as a control for specificity of the antibody. (C) ChIP-qPCR for Ascl1 at the eTlx1 and eTlx3 loci in (A). Limb tissue is negative for Ascl1 and serves as a control for specificity of the antibody. eDll1 is a known target of Ascl1. (D) Co-IP experiments of epitope tagged versions of the proteins transfected into HEK 293 cells indicate specific interaction between Ascl1 and Prdm13 (lane 5), but not the negative control, myc-Hook3 (lane 6). (E–N) Chick neural tube electroporated with either eTlx3::GFP or eTlx1::GFP reporter and expression vectors for Ascl1, Prdm13, or both as indicated. Only the electroporated side is shown and the neural tube is outlined with a dashed line. (E) The eTlx3::GFP signals are restricted and co-localize with dI3/dI5 markers, Tlx1/3 (yellow arrowheads). (E′–H) Ascl1 dramatically induces eTlx3::GFP and this is blocked by Prdm13. (I) The eTlx1::GFP signals are restricted to dI5 neurons (yellow arrowhead). (I′–L) Induction by Ascl1 is more subtle than that seen with eTlx3::GFP but Prdm13 is still repressive. Inset: myc immunofluorescence indicates the electroporation efficiency. (M and N) shows the quantification of these data by measuring pixel intensity. Error bars are reported as SEM. * and # p-value<0.001 relative to control or between samples indicated.

