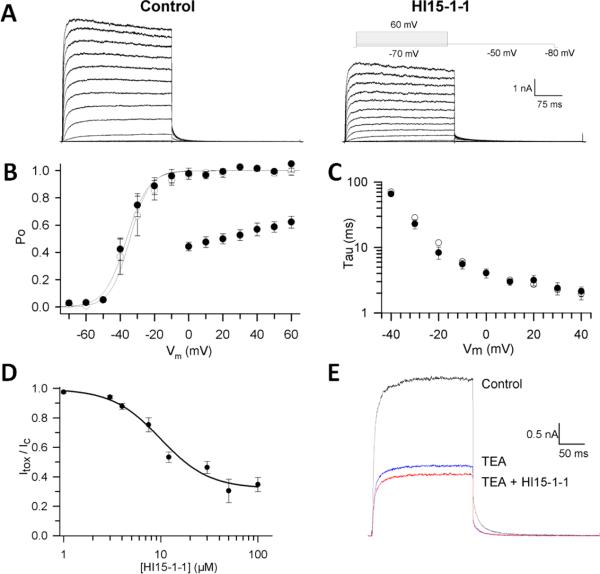
Fig. 5.
Electrophysiological characterization of Hl15-1-1 on Kv1.1. A) Kv1.1 current recordings elicited by 300-ms steps to various potentials (−50 mV to +60 mV) in control conditions (left) and in presence of 9.9 μM Hl15-1-1 (right). B) Voltage dependence of activation. Activation curves were obtained by plotting the normalized tail currents as a function of the prepulse potential. The solid lines represent the average Boltzmann fits in control conditions (open symbols) and in presence of 9.9 μM Hl15-1-1 (closed symbols). Additionally, the voltage dependence of block is shown by plotting the normalized currents at the end of the prepulse in the presence of 9.9 μM Hl15-1-1 as a function of the prepulse voltage (scatter plot). C) Activation time constants derived from mono-exponential fits to the raw current traces were plotted as a function of applied voltage in control conditions (open symbols) and in presence of 9.9 μM Hl15-1-1 (closed symbols). D) Concentration dependence of inhibition by Hl15-1-1 obtained from the normalized current suppression at +40 mV as a function of the Hl15-1-1 concentration, fitted with the Hill equation (solid line). E) Competition between TEAext and Hl15-1-1. Shown are the currents for 250-ms steps to +10 mV for control, steady-state block by 0.4 mM TEAext and the subsequent effect of 9.9 μM Hl15-1-1 together with 0.4 mM TEAext.

