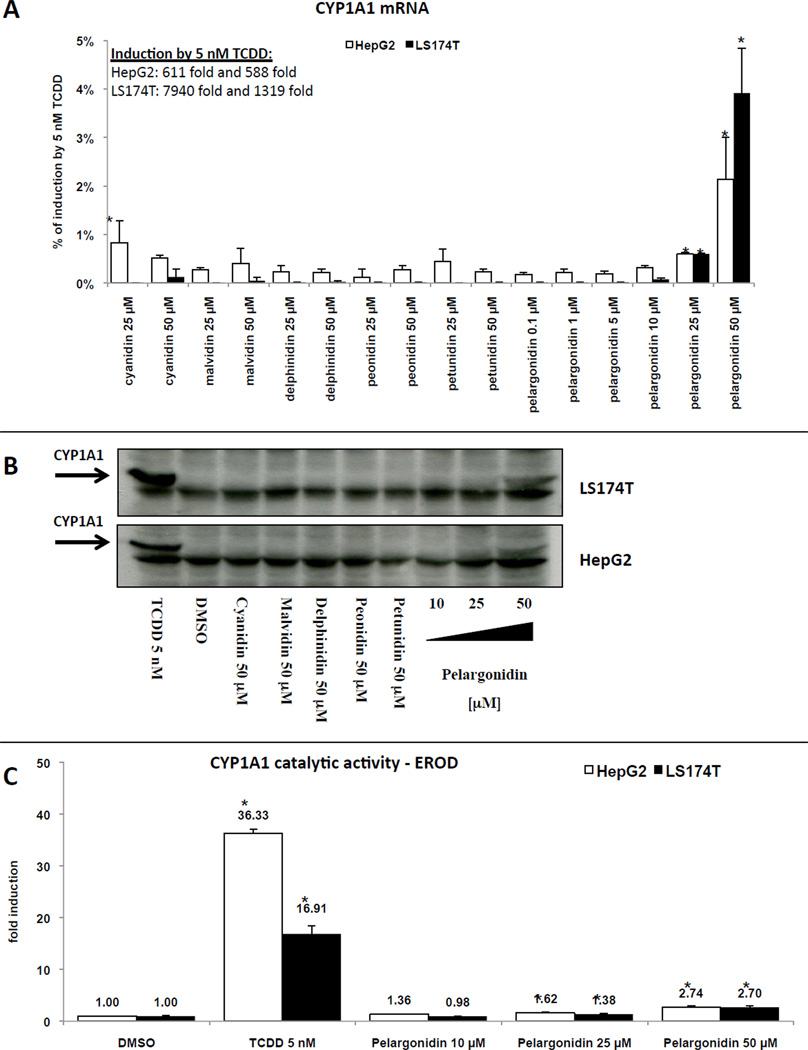
Figure 3. Effects of anthocyanidins on CYP1A1 expression in HepG2 and LS174T cells.
Panel A: Cells were treated with cyanidin (25 µM and 50 µM), delphinidin (25 µM and 50 µM), malvidin (25 µM and 50 µM), peonidin (25 µM and 50 µM), petunidin (25 µM and 50 µM), pelargonidin (0.1 µM, 1 µM, 5 µM, 10 µM, 25 µM and 50 µM), TCDD (5 nM) and vehicle (DMSO; 0.1% v/v). Bar graph shows representative RT-PCR analyses (3 independent experiments) of CYP1A1 mRNA after 24 h treatment. The data are the mean from triplicate measurements and are expressed as percentage of maximal induction attained in TCDD-treated cells. The data were normalized per GAPDH mRNA levels. * - value is significantly different from DMSO-treated cells (p < 0.05) as determined by the Student’s t-test. Panel B: Cells were treated with cyanidin (50 µM), delphinidin (50 µM), malvidin (50 µM), peonidin (50 µM), petunidin (50 µM), pelargonidin (10 µM, 25 µM and 50 µM), TCDD (5 nM) and vehicle (DMSO; 0.1% v/v) for 48 h. Western blots show a representative analysis of CYP1A1 protein. Similar profiles were observed in three independent experiments. As a loading control, the blots were probed to actin (data not shown). Panel C: Cells were treated with pelargonidin (10 µM, 25 µM and 50 µM), TCDD (5 nM) and vehicle (DMSO; 0.1% v/v) for 48 h. Catalytic activity of CYP1A1 (EROD) was measured as described in detail in Methods section. The data are mean from triplicate measurements and are expressed as fold induction over DMSO-treated cells. * - value is significantly different from DMSO-treated cells (p < 0.05) as determined by the Student’s t-test.

