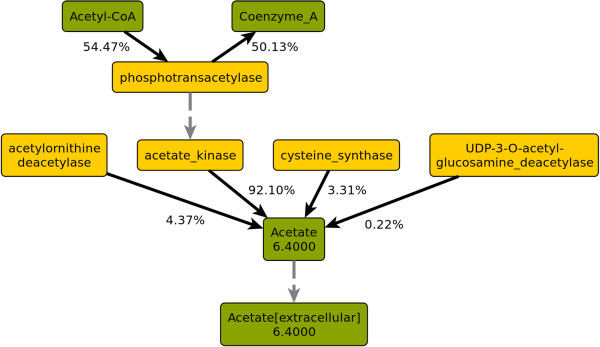
Figure 2.

Split ratios of acetate and adjacent nodes. Green: Metabolite nodes, yellow: enzyme nodes. Numbers in metabolite nodes are total flux in mmol gDW−1 h−1. Edge labels are split ratios as fractions of the flux through the adjacent metabolite node.
