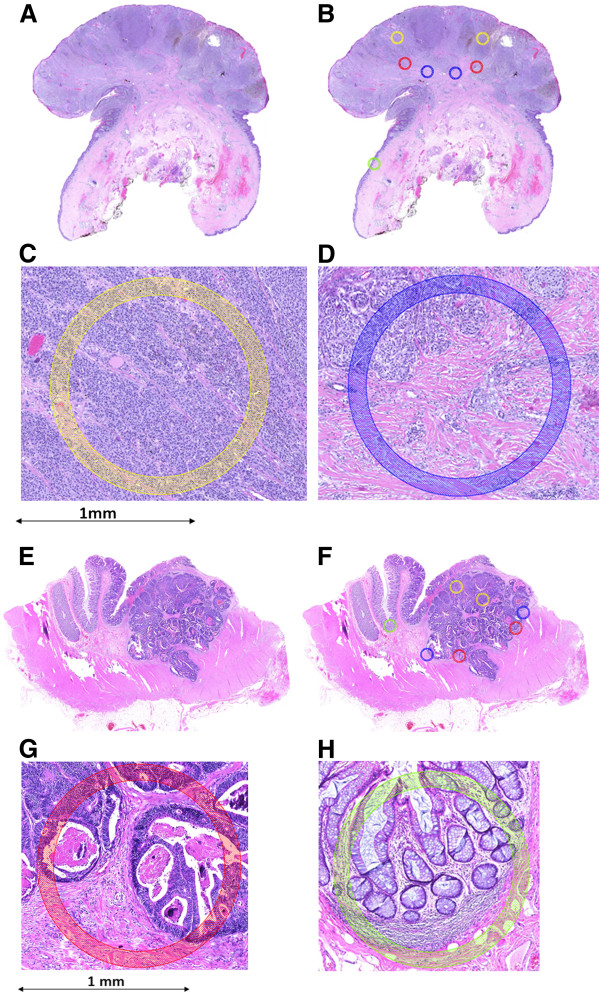
Figure 1.

Two examples showing scanned H&E sections, followed by annotations of specific histological regions and high-power magnifications of two different annotated regions. A-D: malignant melanoma; E-H: colorectal cancer. Yellow annotation: tumor center, blue: tumor microenvironment at most invasive tumor front, red: invasion front, green: normal tissue. 5× magnification.
