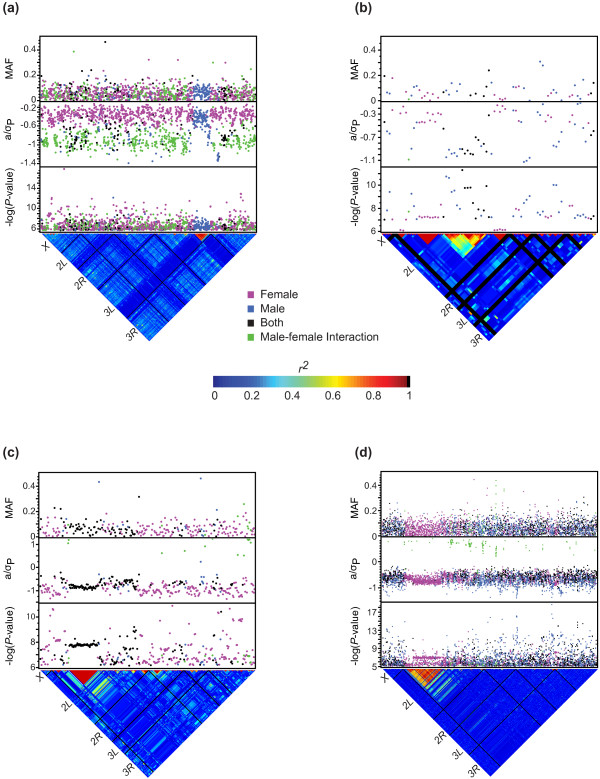
Figure 5.
Genome wide association results for sleep CVE traits. Significant SNPs (FDR ≤ 0.01) are plotted. The top panel shows the minor allele frequency (MAF) for each significant SNP. Effect sizes normalized by the phenotypic standard deviation (a/σP) are plotted in the middle panel. P-values are plotted as –log10(P-value) in the bottom panel. The lower triangle shows the distribution of linkage disequilibrium among SNPs as r2. Solid black lines identify the five major chromosome arms. (a) Night sleep CVE. (b) Day sleep CVE. (c) Day bout number CVE. (d) Waking activity CVE.

