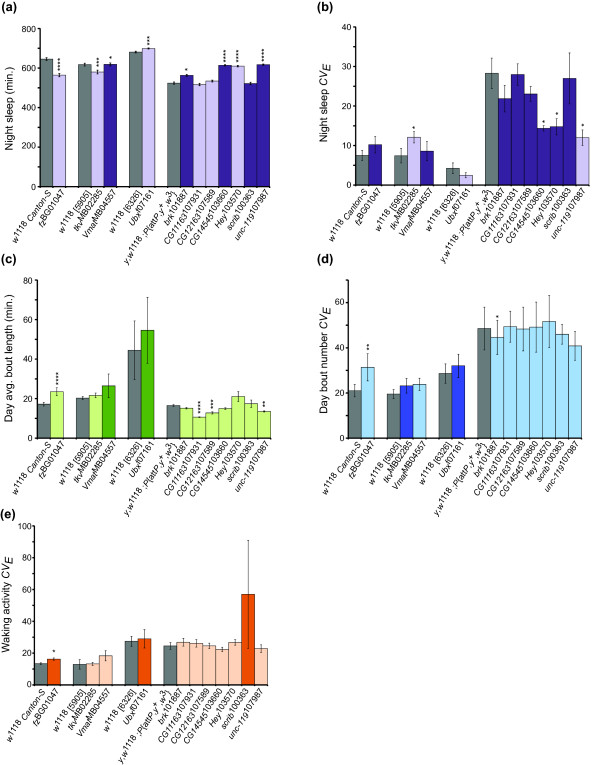
Figure 7.
Results of mutant and RNAi knockdown tests for night sleep parameters. Results are grouped with their respective isogenic control, shown in gray. Combined-sex data are shown. Genes that were identified in the GWAS for a given trait are in the darker shade; genes not significant in the GWAS for a given trait are in the lighter shade. (a) Night sleep. (b) Night sleep CVE. (c) Day average bout length. (d) Day bout number CVE. (e) Waking activity CVE. ns, not significant; * 0.01 ≤ P < 0.05; ** 0.001 ≤ P < 0.01; *** 0.0001 ≤ P < 0.001; **** P <0.0001.

