Figure 1.
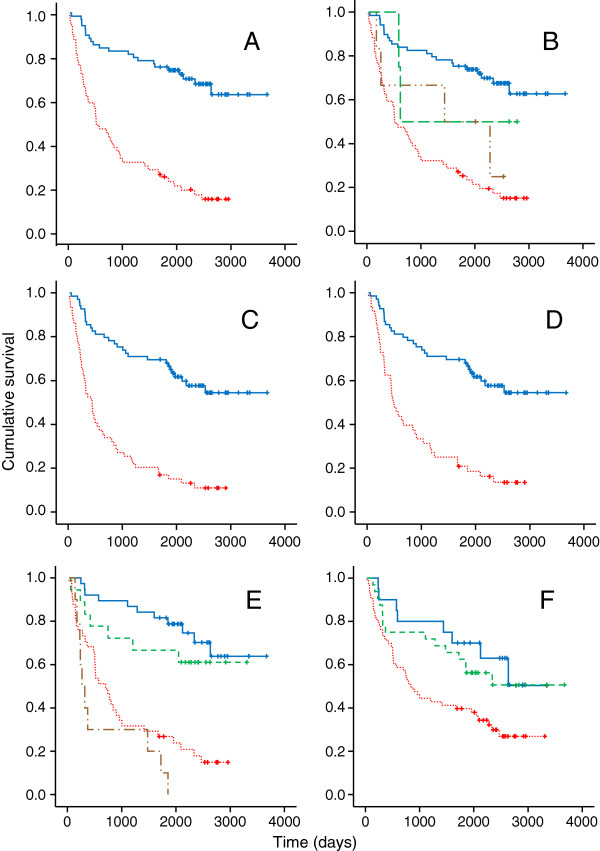
Kaplan-Meier plots. A. Overall survival by HPV status. Blue solid line: HPV-positive patients (n = 69), red dotted line: HPV-negative patients (n = 59). 10 patients with equivocal HPV status are excluded. B. Overall survival in 4 groups classified by p16 expression and presence of HPV DNA. Blue solid line: HPV-positive (Group 3, n = 69), brown dashed/dotted line: p16 negative and ISH/PCR positive (Group 2, n = 6), green dashed line: p16 positive and ISH/PCR negative (Group 4, n = 4), red dotted line: HPV negative (Group 1, n = 59). C. Progression free survival by HPV status. Blue solid line: HPV-positive patients (n = 69), red dotted line: HPV-negative patients (n = 59). 10 patients with equivocal HPV status are excluded. D. Progression free survival in radically treated patients by HPV status. Blue solid line: HPV-positive patients (n = 69), red dotted line: HPV-negative patients (n = 48). 21 patients with equivocal HPV status or palliative intent are excluded. E. Overall survival by HPV and smoking status. Blue solid line: HPV-positive not current smokers (n = 38), green dashed line: HPV-positive current smokers (n = 18), red dotted line: HPV-negative current smokers (n = 41), brown dotted/dashed line: HPV-negative not current smokers (n = 10). Cases with equivocal HPV status or unknown smoking status are excluded. F. Overall survival by smoking status. Blue solid line: non-smokers (n = 20), green dashed line: previous smokers (n = 32), red dotted line: current smokers (n = 63). Cases with unknown smoking status are excluded.

