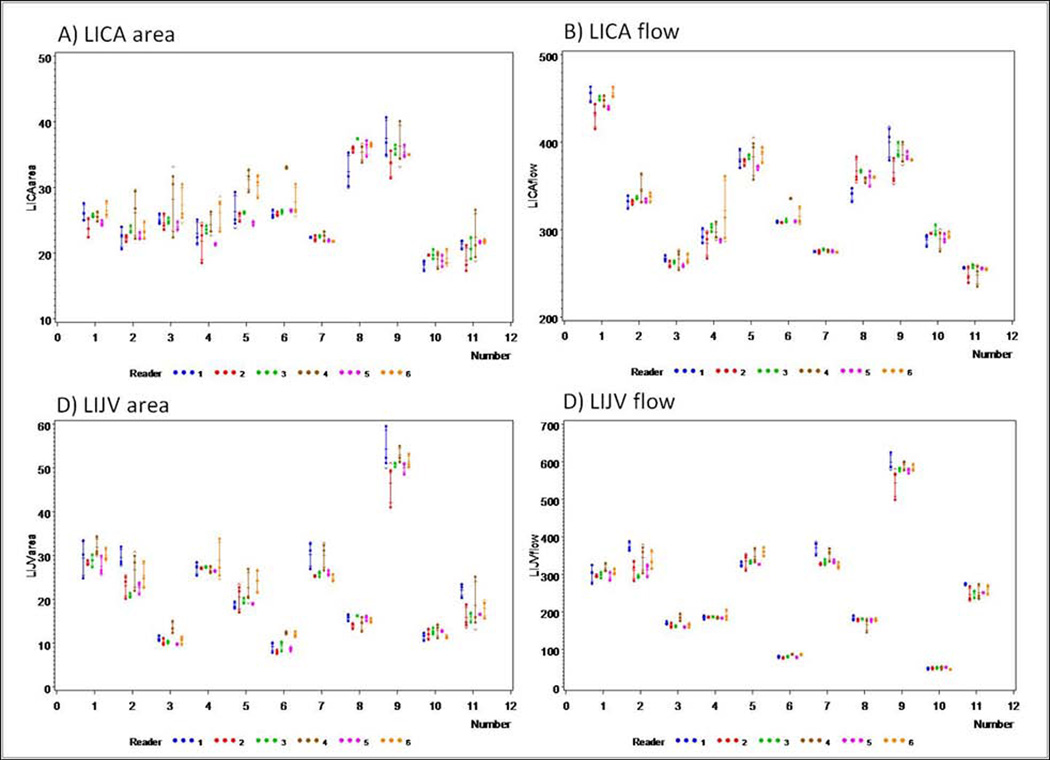
Figure 4.
The figure shows the results of the quantified parameters (A) LICA area; (B) LICA volumetric flow rate; (C) LIJV area; (D) LIJV volumetric flow rate. Measurements are grouped by the subjects 1–12 (center A: subjects 1–6; center B: subjects 7–12) illustrating data points of individual readers (dots) and additionally showing mean (horizontal dash) and standard deviation of repeated measurements (whiskers).

